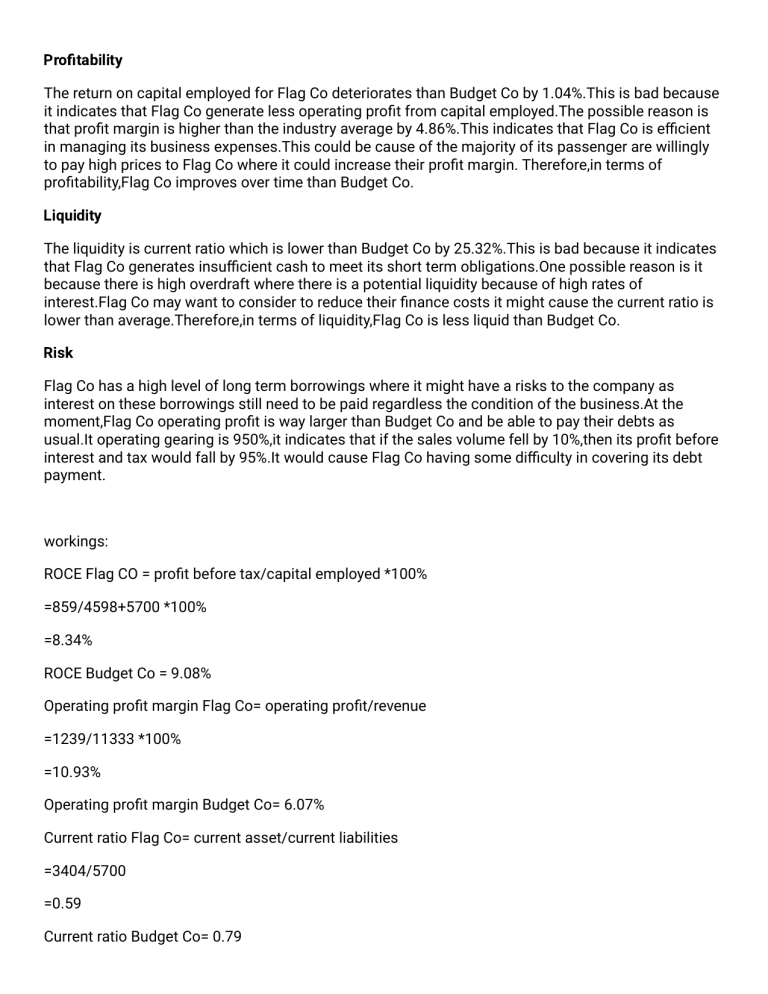
Profitability The return on capital employed for Flag Co deteriorates than Budget Co by 1.04%.This is bad because it indicates that Flag Co generate less operating profit from capital employed.The possible reason is that profit margin is higher than the industry average by 4.86%.This indicates that Flag Co is efficient in managing its business expenses.This could be cause of the majority of its passenger are willingly to pay high prices to Flag Co where it could increase their profit margin. Therefore,in terms of profitability,Flag Co improves over time than Budget Co. Liquidity The liquidity is current ratio which is lower than Budget Co by 25.32%.This is bad because it indicates that Flag Co generates insufficient cash to meet its short term obligations.One possible reason is it because there is high overdraft where there is a potential liquidity because of high rates of interest.Flag Co may want to consider to reduce their finance costs it might cause the current ratio is lower than average.Therefore,in terms of liquidity,Flag Co is less liquid than Budget Co. Risk Flag Co has a high level of long term borrowings where it might have a risks to the company as interest on these borrowings still need to be paid regardless the condition of the business.At the moment,Flag Co operating profit is way larger than Budget Co and be able to pay their debts as usual.It operating gearing is 950%,it indicates that if the sales volume fell by 10%,then its profit before interest and tax would fall by 95%.It would cause Flag Co having some difficulty in covering its debt payment. workings: ROCE Flag CO = profit before tax/capital employed *100% =859/4598+5700 *100% =8.34% ROCE Budget Co = 9.08% Operating profit margin Flag Co= operating profit/revenue =1239/11333 *100% =10.93% Operating profit margin Budget Co= 6.07% Current ratio Flag Co= current asset/current liabilities =3404/5700 =0.59 Current ratio Budget Co= 0.79

