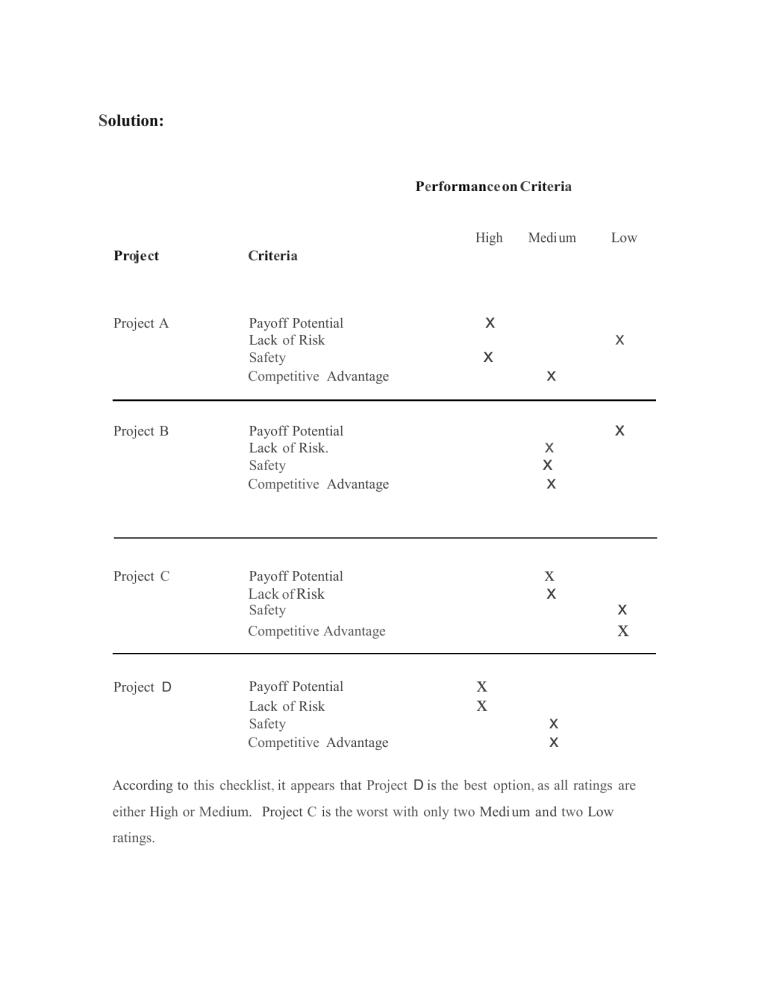
Solution: Performance on Criteria High Project Criteria Project A Payoff Potential Lack of Risk Safety Competitive Advantage Project B Project C Project D Low x x x x Payoff Potential Lack of Risk. Safety Competitive Advantage x x x x x Payoff Potential Lack of Risk Safety Competitive Advantage Payoff Potential Lack of Risk Safety Competitive Advantage Medi um x x x x x x x According to this checklist, it appears that Project D is the best option, as all ratings are either High or Medium. Project C is the worst with only two Medi um and two Low ratings. Solution: Project Criteria (A) Importance Weight (B) Score (A) x (B) Weighted Score Project A Payoff Potential 4 3 12 Lack of risk 3 1 3 Safety 1 3 3 Competitive Ad vantage 3 2 6 Total Score 24 Project Criteria Weight Score . Project B Payoff Potential 4 1 4 Lack of risk 3 2 6 2 2 2 6 Safety Competitive Advantage 1 3 Total Score 18 Project C Payoff Potential 4 2 8 Lack of risk 3 2 6 Safety Competitive Advantage 1 3 1 1 Total Score 1 3 18 Project D Payoff Potential 4 3 12 Lack of risk 3 3 9 2 2 2 6 Safety Competitive Advantage Total Score 1 3 29 Therefore: Choose Project D, which has the highest total score of 29, and the worst is Project C and B. With lowest score of 18 Solution: Project Carol Year inflows Outflows Net-flows Discount Factor NPV 0 500,000 (500,000) 1.000 (500,000) 1 50,000 50,000 0.81 40,500 2 250,000 250,000 0.66 165,000 4 350,000 350,000 0.54 189,000 Total $(105,500) Project George Year Inflows 0 Outflows Net flows Discount Factor NPV 250,000 (250,000) 1.000 (250,000) 1 75,000 75,000 0.81 60,750 2 75,000 75,000 0.66 49,500 3 75,000 75,000 0.54 40,500 4 50,000 50,000 0.44 22,000 Total $(77,250) Project Thomas Year Inflows 0 Outflows Net flows Discount Factor NPV 1,000,000 (1,000,000) 1.000 (1,000,000) 1 200,000 200,000 0.81 162,000 2 200,000 200,000 0.66 132,000 3 200,000 200,000 0.54 108,000 4 200,000 200,000 0.44 88,000 5 200,000 200,000 0.36 72,000 6 200,000 200,000 0.29 58,000 $(380,000) Total Project Anna Year Inflows 0 Out flows Net f lows Discount Factor NPV 75,000 (75,000) 1.000 (75,000) 1 15,000 15,000 0.81 12,150 2 25,000 25,000 0.66 16,500 3 50,000 50,000 0.54 27,000 4 50,000 50,000 0.44 22,000 5 150,000 150,000 0.36 54,000 Total $56,650 Conclusion s: The only project worth investing in is Project Anna, because it is the only project with a positive projected NPV. Each of the other three will not pay back the initial investment due to the high cost of capital (discount rate) the firm uses.
