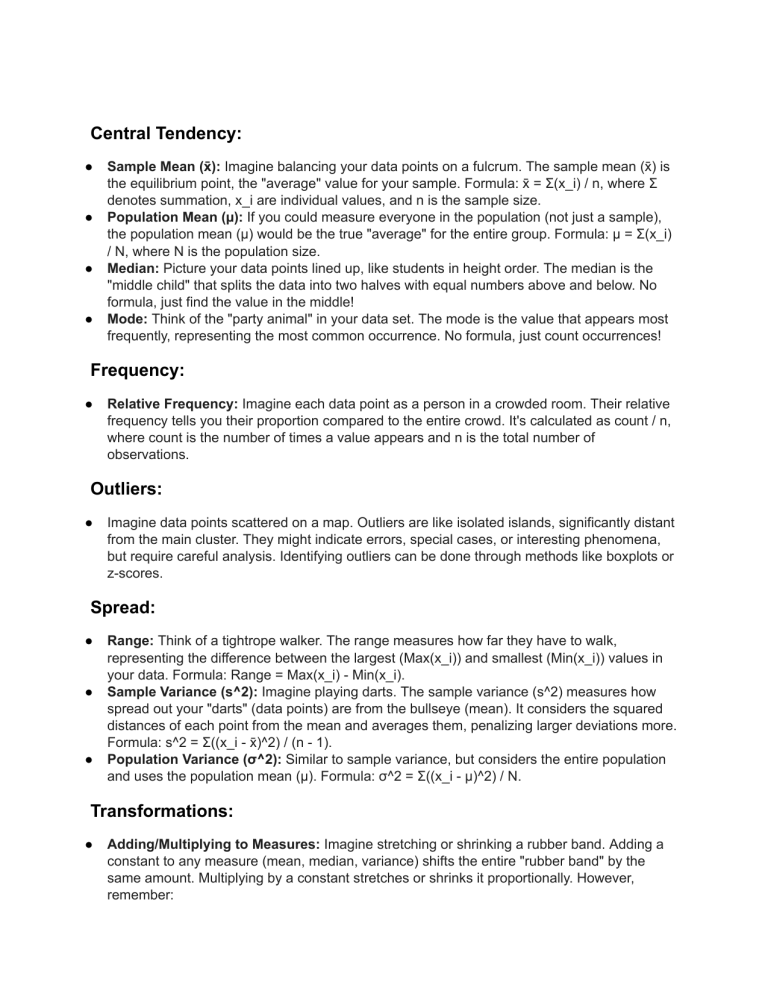
Central Tendency: ● ● ● ● Sample Mean (x̄): Imagine balancing your data points on a fulcrum. The sample mean (x̄) is the equilibrium point, the "average" value for your sample. Formula: x̄ = Σ(x_i) / n, where Σ denotes summation, x_i are individual values, and n is the sample size. Population Mean (µ): If you could measure everyone in the population (not just a sample), the population mean (µ) would be the true "average" for the entire group. Formula: µ = Σ(x_i) / N, where N is the population size. Median: Picture your data points lined up, like students in height order. The median is the "middle child" that splits the data into two halves with equal numbers above and below. No formula, just find the value in the middle! Mode: Think of the "party animal" in your data set. The mode is the value that appears most frequently, representing the most common occurrence. No formula, just count occurrences! Frequency: ● Relative Frequency: Imagine each data point as a person in a crowded room. Their relative frequency tells you their proportion compared to the entire crowd. It's calculated as count / n, where count is the number of times a value appears and n is the total number of observations. Outliers: ● Imagine data points scattered on a map. Outliers are like isolated islands, significantly distant from the main cluster. They might indicate errors, special cases, or interesting phenomena, but require careful analysis. Identifying outliers can be done through methods like boxplots or z-scores. Spread: ● ● ● Range: Think of a tightrope walker. The range measures how far they have to walk, representing the difference between the largest (Max(x_i)) and smallest (Min(x_i)) values in your data. Formula: Range = Max(x_i) - Min(x_i). Sample Variance (s^2): Imagine playing darts. The sample variance (s^2) measures how spread out your "darts" (data points) are from the bullseye (mean). It considers the squared distances of each point from the mean and averages them, penalizing larger deviations more. Formula: s^2 = Σ((x_i - x̄)^2) / (n - 1). Population Variance (σ^2): Similar to sample variance, but considers the entire population and uses the population mean (µ). Formula: σ^2 = Σ((x_i - µ)^2) / N. Transformations: ● Adding/Multiplying to Measures: Imagine stretching or shrinking a rubber band. Adding a constant to any measure (mean, median, variance) shifts the entire "rubber band" by the same amount. Multiplying by a constant stretches or shrinks it proportionally. However, remember: ○ Variance and covariance are squared measures, so multiplying them by a constant increases them by the square of the factor. Deeper Dives: ● ● ● ● ● ● Percentile: Imagine dividing your data into 100 equal slices. The pth percentile is the value where p% of data falls below it. The 50th percentile is the median! IQR (Interquartile Range): Imagine a box with your data inside. The IQR represents the height of the middle 50% of the data, calculated as the difference between the 75th and 25th percentiles. Contingency Tables: Imagine a two-dimensional grid where rows and columns represent different categories. Contingency tables organize data by two categorical variables, showing how frequently observations fall into each combination. Analyze these tables using chi-square tests to see if the variables are related. Row/Column Relative Frequency: Imagine each cell in the contingency table as a slice of pie. The row/column relative frequency tells you the proportion of observations within that cell compared to the total for that row/column. Use these proportions to compare categories within each variable. Covariance: Imagine two friends, their height and weight. Covariance measures how their changes in height tend to relate to changes in weight. A positive covariance suggests they tend to move in the same direction (taller and heavier, or shorter and lighter), while negative indicates opposite trends. It's not standardized, so interpret with caution. Correlation: Covariance is like the raw score on a friendship test, but correlation is the standardized version, ranging from -1 (perfect negative relationship) to 1 (perfect positive), with 0 indicating no linear relationship. It's like comparing friendship scores across different groups. Use it to assess the strength and direction of linear relationships between variables. Formulae Central Tendency: ● ● ● ● Sample Mean (x̄): x̄ = Σ(x_i) / n Population Mean (µ): µ = Σ(x_i) / N Median: No formula, just find the middle value in sorted data. Mode: No formula, just identify the most frequent value. Frequency: ● Relative Frequency: f_i / n, where f_i is the frequency of a value and n is the total number of observations. Spread: ● ● ● Range: Range = Max(x_i) - Min(x_i) Sample Variance (s^2): s^2 = Σ((x_i - x̄)^2) / (n - 1) Population Variance (σ^2): σ^2 = Σ((x_i - µ)^2) / N Transformations: ● ● Adding a constant to any measure: New value = original value + constant Multiplying a constant to any measure: New value = original value * constant Deeper Dives: ● ● ● Percentile: No specific formula, calculated by finding the value where p% of data falls below it in sorted data. IQR (Interquartile Range): IQR = Q3 - Q1, where Q3 is the 75th percentile and Q1 is the 25th percentile. Contingency Tables: No formula, used to organize and analyze data by frequency of observations falling into different categories. Note: ● ● ● ● ● ● Σ represents summation. x_i represents individual data points. n is the sample size. N is the population size. Max(x_i) is the largest value in the data set. Min(x_i) is the smallest value in the data set..


