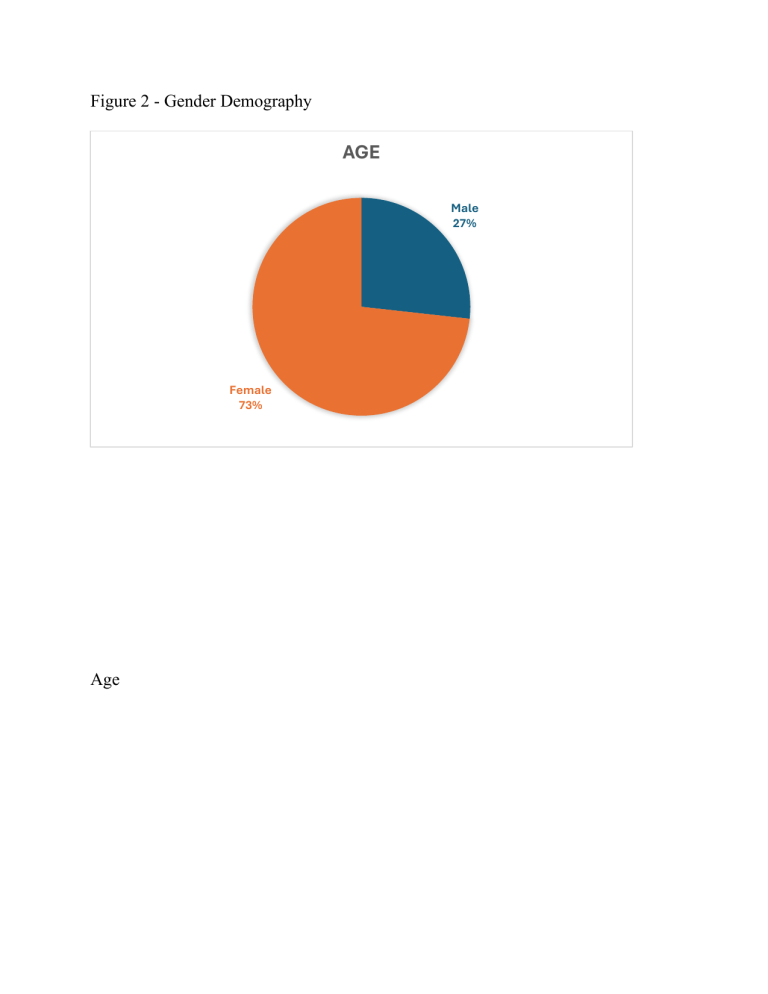
Figure 2 - Gender Demography AGE Male 27% Female 73% Age Age 4% 25% 71% 15-18 19-25 26-40 English Language Exposure English Language Experience 4% 6% 8% 82% Less than 1 year 2 - 3 years Language Learning Goals Less than 5 years More than 5 years Chart Title 5 4.5 4 3.5 3 2.5 2 1.5 1 0.5 0 To advance my career oppurtunities Category 2 Series 1 Preference in language learning Category 3 Column2 Column1 Category 4 Chart Title 60 50 40 30 Series 1 20 10 0 1 2 3 4 5 6 7 8 9 10 11 12 13 1 I prefer learning through conversations and interactions 2 I am comfortable using technology for language learning 3 I prefer learning through group works. 4 I prefer learning individually. 5 I like learning by experiencing things, like real-life situations or practical examples. 6 I think learning with videos, audios, or pictures is a good way to understand 7 I enjoy learning through fun activities and games. 8 I prefer learning from books or written materials. 9 I like it when learning includes interesting facts about different cultures. 10 Learning by pretending or acting out things helps me understand better. 11 Stories make learning more enjoyable for me. 12 I like it when there's a clear plan and goals for what I'm learning. 13 Learning step by step, in an organized way, is easier for me. Preferred task type. Sales 12% 6% 3% 15% 14% 11% 8% 5% 14% 12% problem-solving Interaction with peers Learning using technology Role playing Collaborative group activities Multimedia-based learning (videos, audio) Storytelling and narratives Individual exercises and practice Vocabulary games and exercises Real-life situational tasks Preference of group work Group Working Preference Strongly Disagree Disagree Neither Agree nor disagree Agree Strongly Agree

