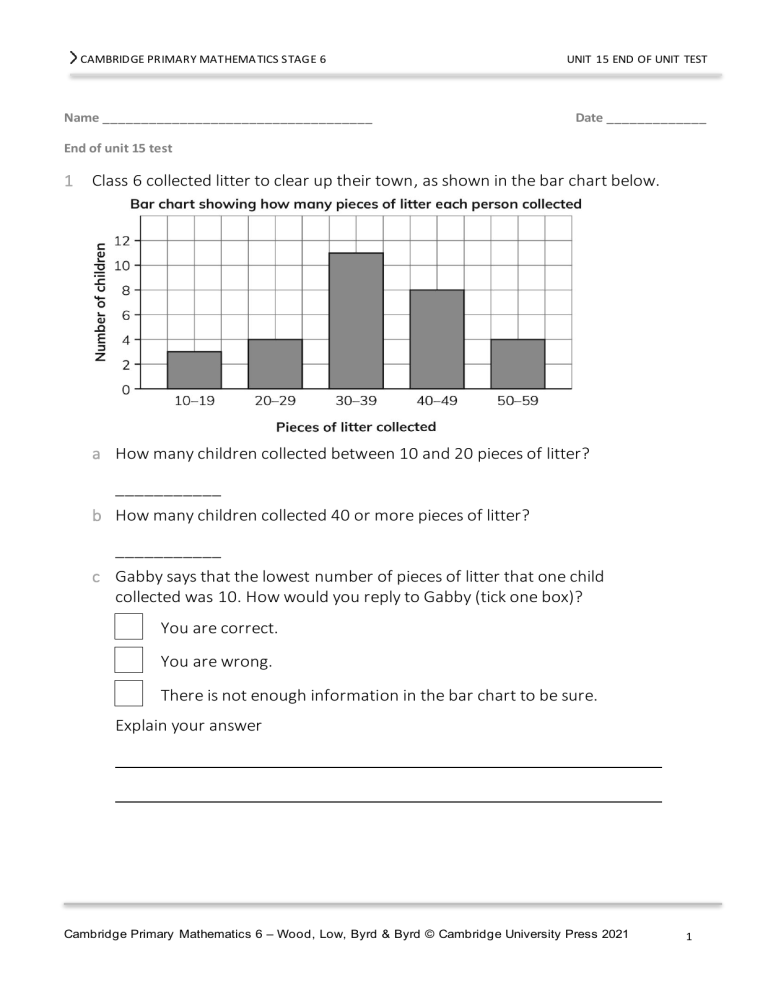
CAMBRIDGE PRIMARY MATHEMA TICS STAGE 6 Name ___________________________________ UNIT 15 END OF UNIT TEST Date _____________ End of unit 15 test 1 Class 6 collected litter to clear up their town, as shown in the bar chart below. a How many children collected between 10 and 20 pieces of litter? ___________ b How many children collected 40 or more pieces of litter? ___________ c Gabby says that the lowest number of pieces of litter that one child collected was 10. How would you reply to Gabby (tick one box)? You are correct. You are wrong. There is not enough information in the bar chart to be sure. Explain your answer Cambridge Primary Mathematics 6 – Wood, Low, Byrd & Byrd © Cambridge University Press 2021 1 CAMBRIDGE PRIMARY MATHEMA TICS STAGE 6 2 UNIT 15 END OF UNIT TEST A group of people were asked to name their favourite fruit juice. Estimate the percentage of people who chose each flavour. a orange ___________ b pineapple ___________ 3 c mango ___________ d apple ___________ e peach ___________ Shane recorded the temperature of a hot drink every ten minutes for one hour. These are the results: Time (minutes) 0 10 20 30 40 50 60 Temperature (°C) 75 61 48 32 20 18 18 a Would the data be better represented in a dot plot or a line graph? Why? Cambridge Primary Mathematics 6 – Wood, Low, Byrd & Byrd © Cambridge University Press 2021 2 CAMBRIDGE PRIMARY MATHEMA TICS STAGE 6 UNIT 15 END OF UNIT TEST b Draw a line graph to represent the data in the table. c Use your line graph to estimate the temperature of the drink at 25 minutes. ___________ d Use your line graph to estimate when the temperature dropped to 30 °C. ________________ 4 This table shows the highest temperature each day for a week and how much water was sold in a shop. Temperature (°C) 15 22 23 24 35 18 22 26 31 Water (litres) 10 18 30 40 50 14 24 30 40 Temperature (°C) 37 18 27 32 27 Water (litres) 48 18 24 30 48 Cambridge Primary Mathematics 6 – Wood, Low, Byrd & Byrd © Cambridge University Press 2021 3 CAMBRIDGE PRIMARY MATHEMA TICS STAGE 6 UNIT 15 END OF UNIT TEST a Draw a scatter graph to represent the data in the table. b Draw a line of best fit on your scatter graph. c Use your line of best fit to estimate how much water would be sold by the shop if the highest temperature of the day was 30 °C. ___________ Cambridge Primary Mathematics 6 – Wood, Low, Byrd & Byrd © Cambridge University Press 2021 4
