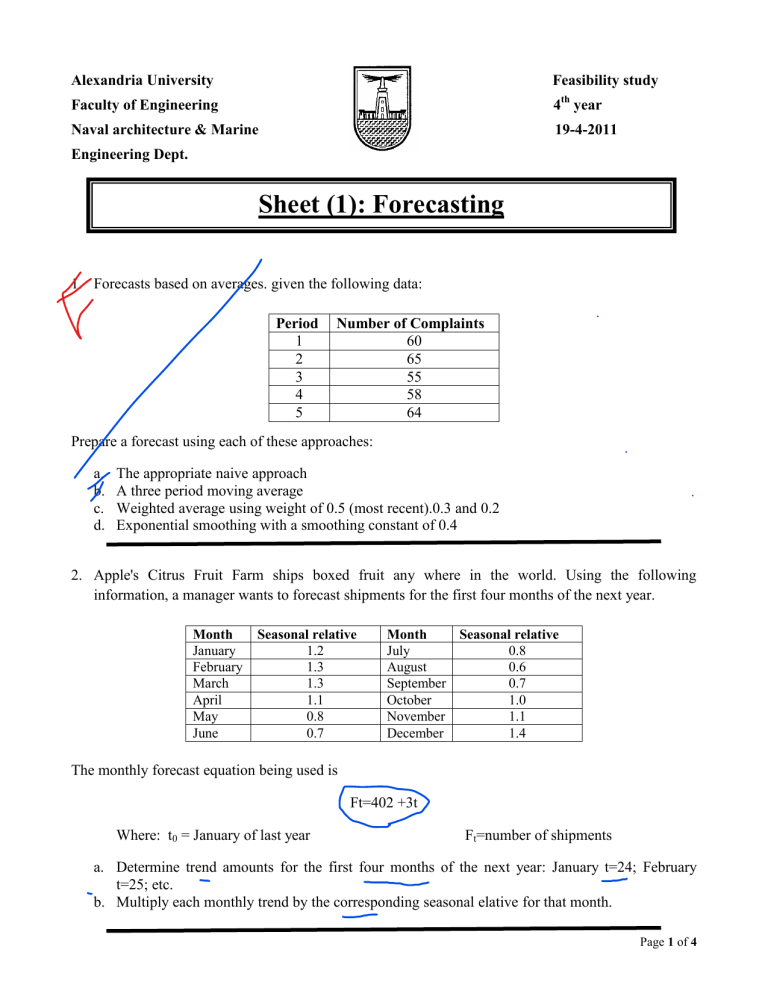
Alexandria University Feasibility study Faculty of Engineering 4th year Naval architecture & Marine 19-4-2011 Engineering Dept. Sheet (1): Forecasting 1. Forecasts based on averages. given the following data: Period 1 2 3 4 5 Number of Complaints 60 65 55 58 64 Prepare a forecast using each of these approaches: a. b. c. d. The appropriate naive approach A three period moving average Weighted average using weight of 0.5 (most recent).0.3 and 0.2 Exponential smoothing with a smoothing constant of 0.4 2. Apple's Citrus Fruit Farm ships boxed fruit any where in the world. Using the following information, a manager wants to forecast shipments for the first four months of the next year. Month January February March April May June Seasonal relative 1.2 1.3 1.3 1.1 0.8 0.7 Month Seasonal relative July 0.8 August 0.6 September 0.7 October 1.0 November 1.1 December 1.4 The monthly forecast equation being used is Ft=402 +3t Where: t0 = January of last year Ft=number of shipments a. Determine trend amounts for the first four months of the next year: January t=24; February t=25; etc. b. Multiply each monthly trend by the corresponding seasonal elative for that month. Page 1 of 4 3. Plot the data on graph and verify that a linear trend line is appropriate .develop a line trend equation for the following data; then use the equation to predict the next two values of the series. Period 1 2 3 4 5 6 7 8 9 Demand 44 52 50 54 55 55 60 56 62 4. Obtain estimates of quarter relatives for these data: Year Quarter Demand 1 1 14 2 18 2 3 35 4 46 1 28 2 36 3 3 60 4 71 1 45 2 54 3 84 4 1 58 4 88 5. The owner of small hardware store has noted a sales pattern for window locks that seems to parallel the number of break-ins reported each week in the news paper. the data are: Sales Break-Ins 46 9 18 3 20 3 22 5 27 4 34 7 14 2 37 6 30 4 a. Plot the data to determine which type of equation linear or non-linear is appropriate. b. Obtain a regression equation for the data. Estimate sales when the number of break-ins is five. 6. Given the demand data that follow, prepare a naive forecast for periods 2 through 10. Then determine each forecast error and use those values to obtain 2s control limit. If demand in the next two periods turn out to be 125 and 130 can u conclude that forecasts are in control? Period Demand 1 118 2 117 3 120 4 119 5 126 6 122 7 117 8 123 9 121 10 124 Page 2 of 4 7. A commercial bakery has recorded sales (in dozens) for three products, as shown below: Day 1 2 3 4 5 6 7 8 9 10 11 12 13 14 15 Blueberry Muffins 30 34 32 34 35 30 34 36 29 31 35 31 37 34 33 Cinnamon Buns Cupcakes 18 17 19 19 22 23 23 25 24 26 27 28 29 31 33 45 26 27 23 22 48 29 20 14 18 47 26 27 24 22 a. Predict orders for the following day for each of the products using an appropriate method.(Hint: plot each data set) b. What should the use of sales data instead of demand imply? 8. National mixer, Inc., sells can openers. Monthly sales for a seven-month period were as follows: a. b. c. d. Month Sales (000units) Feb 19 Mar 18 Apr 15 May 20 Jun 18 Jul 22 Aug 20 Plot the monthly data on a sheet on graph paper. Forecast September sales volume using each of the following: 1) A linear trend equation 2) A five-month moving average 3) Exponential smoothing with smoothing constant equal to 20, assuming a March forecast of 19000. 4) The naive approach. 5) A weighted average using 60 for August, 30 for July, and 10 for June Which method seems least appropriate? Why? (Hint: refer to your plot from part a) What does use of the term sales rather that demand presumes? Page 3 of 4 9. A dry cleaner uses exponential smoothing to forecast equipment usage at its man plant. August usage was forecast to be 88 percent to capacity; actual usage 89.6 percent of capacity. A smoothing constant of 0.1 is used a. Prepare a forecast for September. b. Assuming actual September usage of 92 percent, prepare a forecast for October usage. 10. Freight car loading over a 12-year period at a busy port are Week 1 2 3 4 5 6 Number 220 245 280 275 300 310 Week 7 8 9 10 11 12 Number 350 360 400 380 420 450 Week 13 14 15 16 17 18 Number 460 475 500 510 525 541 Determine a linear trend line for freight car loadings. a. Use the trend equation to predict loadings for weeks 20 and 21. b. The manager intends to install new equipment when the volume exceeds 800 loading per week. Assuming the current trend continues, the loading will reach that level in approximately what week? 11. Managers of a store that sells and installs hot tubs want to prepare a forecast for January, February, and March of the next year. Her forecasts are a combination of trend and seasonality. She uses the following equation to estimate the trend component of monthly demand: Ft = 70 +5t, where t=0 in June of the last year. Seasonal relative are 1.10 for January, 1.02 for February, and 95 for March. What demands should she predict? Good Luck Dr. Ghada El Khayat Eng. Hossam Salah Page 4 of 4
