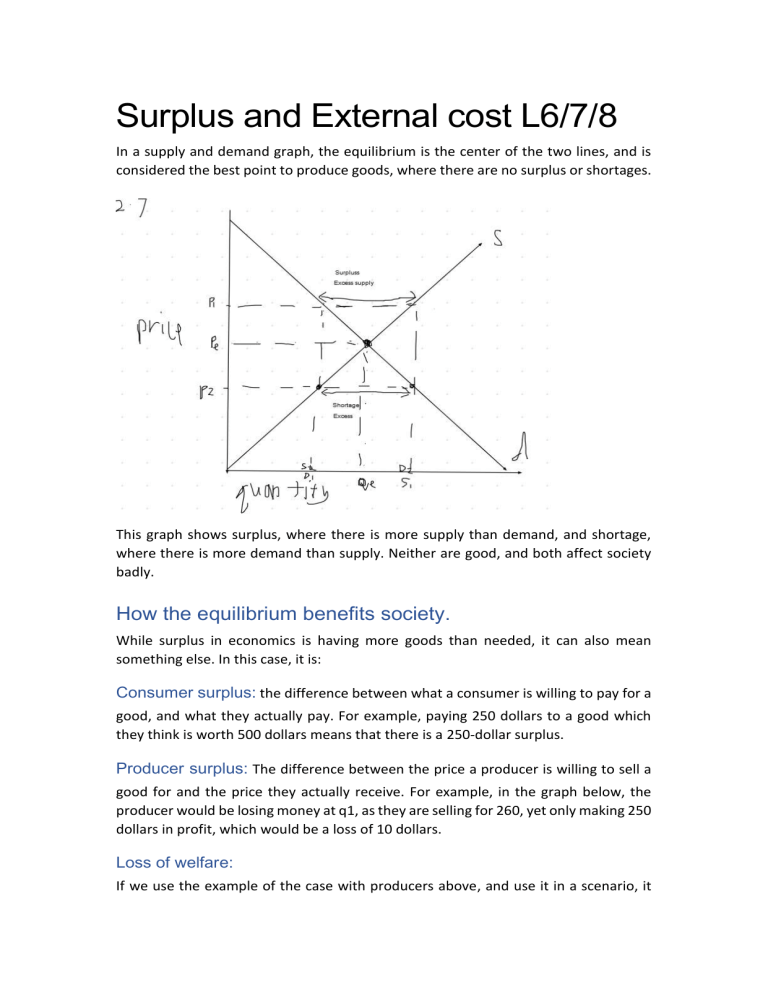
Surplus and External cost L6/7/8 In a supply and demand graph, the equilibrium is the center of the two lines, and is considered the best point to produce goods, where there are no surplus or shortages. This graph shows surplus, where there is more supply than demand, and shortage, where there is more demand than supply. Neither are good, and both affect society badly. How the equilibrium benefits society. While surplus in economics is having more goods than needed, it can also mean something else. In this case, it is: Consumer surplus: the difference between what a consumer is willing to pay for a good, and what they actually pay. For example, paying 250 dollars to a good which they think is worth 500 dollars means that there is a 250-dollar surplus. Producer surplus: The difference between the price a producer is willing to sell a good for and the price they actually receive. For example, in the graph below, the producer would be losing money at q1, as they are selling for 260, yet only making 250 dollars in profit, which would be a loss of 10 dollars. Loss of welfare: If we use the example of the case with producers above, and use it in a scenario, it would be like this: If the consumers are only willing to pay 230 for a good which is worth 250, they will not buy it, as it is not beneficial. Thus, we can see that the purple section is the loss of welfare, where both the consumers and producers lose in society. In conclusion, from looking at the scenarios above, we can see how the equilibrium benefits the society the most. This graph below would be the ideal society with clear boundaries related to consumer and producer surplus. External, private, and social cost: External costs, as remembered in the last few lessons is the cost to everyone except the producer. In the graph below, S2 is what affects everybody except for the producers. External cost is the change from point S1 to S2. Private cost is represented as S1. This is what the producers think would cost to make, as it is the costs the solely the producer, excluding everything else, from consumers, environmental, and more. Producers produce at S1, as it is assumed that producers do not care about social welfare. Social cost is the cost which affects everyone, including the producer of the good and everyone else who is affected by this cost. This can be calculated by “external cost + private cost”. Loss of Welfare Welfare can be defined as the “overall satisfaction a consumer or producer gains from a transaction”. A loss of welfare can be described as a “loss of overall satisfaction for a consumer or producer”. Benefits, external and Private Private benefit is the benefit to the consumer from consuming a good. External benefit: Benefits to everyone apart from the consumer of the good. Social benefit: Caring about all the benefits, including private and external benefit. This can also be calculated as private benefit + social benefit. The social optimum The more demand for the good, the higher the price and output. The opposite would be the loss of welfare Names of goods Merit goods: A good which has external benefit Demerit good: A good which has external costs. Positive externality: an external benefit. Monopoly A monopoly is a situation where there is only one dominant seller of a good or service. Mono means 1, so a duopoly is where there are only two dominant sellers of a good or service, such as Airbus and Boeing. Problems of a monopoly: 1. Monopolies can raise prices above equilibrium. a. They can do this, as they have no competitors b. This results in an inelastic PED, as consumers can continue to buy goods, but it can also lead to a loss of welfare if the producer raise prices above the equilibrium. 2. A monopoly can restrict supply below the equilibrium, as raising supply reduces their prices. Benefits of a monopoly: 1. Higher profits can be used to invest in new technology (R&D) 2. A monopoly will still have to compete if there is the potential for other companies to join the market. a. The threat of other firms entering the market and charging lower prices can make a monopoly lower their price. 3. Some very expensive projects are more efficient if they are run by a monopoly (due to there being a very high one-off cost in building infrastructure). Taxation Taxes are the money which the government would take from you, whether if it is that you are spending money, or earning money. An example of taxes paid in France. In France, there are protests regarding the high taxes which ordinary people are paying. The reason is that Frenchmen have to pay taxes which often are as high as 75% of their income. In France if you earn: 200,000 10,000: 0% tax (0) 20,000: 10% tax (2,000) 70,000: 40% tax (28,000 100,000: 75% tax (75,000) Which is a total of 105,000 euros. Thus, a Frenchmen who earns 200,00 euros will be paying 105,000 euros, or 52.5% of their income. Indirect tax Indirect tax is the tax paid by producers or a third person. Indirect taxes can make products more expensive, as producers will have to increase prices to make a profit. In this graph, we can see that as producers are taxed, the supply curve moves to the left, meaning that price increases for the amount of goods sold. We can also see that consumer surplus was initially above P1 but has now moved to P2. This means that the consumer surplus is now much smaller, hence the reduced interest in the product due to increased prices. Likewise, producer surplus was above P1, but is now P2, as they have benefited form the tax. However, they also suffer, as it now costs them more to make a good, and that there is now less demand. Calculating the amount of money consumers pay. In this graph there are three points. They are: P1 P2 P3 P1 was the original equilibrium price, and P3 is the price which the product is with tax added. P2 is the buffer zone between the two, with the difference between P1 as what consumers pay, as it represent the increase in shelf price, and the difference between P2 and P3 is what the manufacturer pays. Subsidy Subsidy can often be defined as the opposite of indirect tax. It is when the government pays companies money to boost production of a certain good, which subsequently causes the supply curve to shift to the right. Represented in a graph When a project is subsidized, the price of a product sold is lowered. This is because the consumer gains part of the subsidy-the lowered price and the producer gains part of the subsidy-money which is earned due to increased demand due to lower prices, and thus more profit. In the graph below, s is represented as the original equilibrium-without a subsidy. Whereas when subsidy is given, S moves to S2, along with the subsidy. As the price decreases, the red rectangle represents the money which is given to the consumer-lowered prices. The yellow rectangle is represented as the money which is given to the producer-capability to produce cheaper goods. We can also try and find subsidy per unit of goods. This would be calculated by the subsidy divided by number of units sold which leads to Q1 in the upcoming graphs. Thus, the total subsidy is the subsidy per unit times the number of units. [(P3-P1) times Q1]. Revenue in subsidy: Revenue is essentially price times quantity of goods sold. When indirect taxes are placed on a good, revenue for that particular good decreases, and when subsides are granted to a specific good, revenue for that particular good increases. Represented in a graph: If revenue is to be represented in a graph, then the graph below would be a good example. The old equilibrium would be Qe and Pe, while the new one would be Q1 and P1. The whole shaded area in blue is the new revenue after a subsidy. Consumer Expenditure Consumer expenditure is the price paid times output. From using the graph above, the old price and output would be Pe times Qe, and the new one being P1 times Q1. The change in consumer expenditure is Pe times Qe minus P1 times Q1. P3 would be the price received by the producer.
