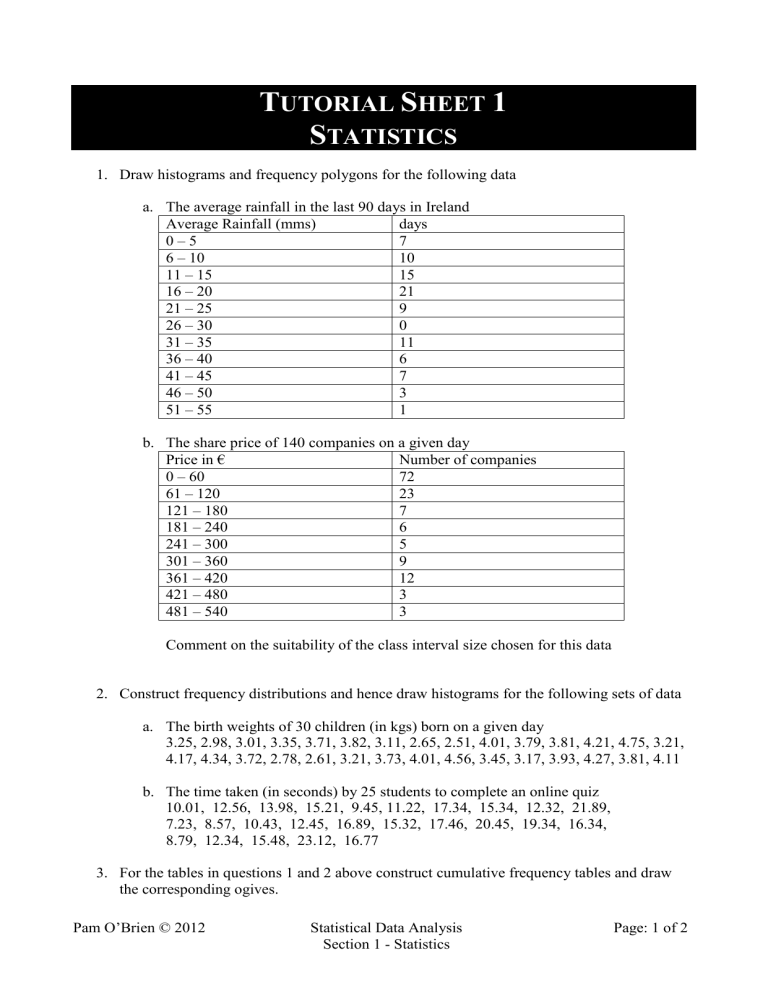
TUTORIAL SHEET 1 STATISTICS 1. Draw histograms and frequency polygons for the following data a. The average rainfall in the last 90 days in Ireland Average Rainfall (mms) days 0–5 7 6 – 10 10 11 – 15 15 16 – 20 21 21 – 25 9 26 – 30 0 31 – 35 11 36 – 40 6 41 – 45 7 46 – 50 3 51 – 55 1 b. The share price of 140 companies on a given day Price in € Number of companies 0 – 60 72 61 – 120 23 121 – 180 7 181 – 240 6 241 – 300 5 301 – 360 9 361 – 420 12 421 – 480 3 481 – 540 3 Comment on the suitability of the class interval size chosen for this data 2. Construct frequency distributions and hence draw histograms for the following sets of data a. The birth weights of 30 children (in kgs) born on a given day 3.25, 2.98, 3.01, 3.35, 3.71, 3.82, 3.11, 2.65, 2.51, 4.01, 3.79, 3.81, 4.21, 4.75, 3.21, 4.17, 4.34, 3.72, 2.78, 2.61, 3.21, 3.73, 4.01, 4.56, 3.45, 3.17, 3.93, 4.27, 3.81, 4.11 b. The time taken (in seconds) by 25 students to complete an online quiz 10.01, 12.56, 13.98, 15.21, 9.45, 11.22, 17.34, 15.34, 12.32, 21.89, 7.23, 8.57, 10.43, 12.45, 16.89, 15.32, 17.46, 20.45, 19.34, 16.34, 8.79, 12.34, 15.48, 23.12, 16.77 3. For the tables in questions 1 and 2 above construct cumulative frequency tables and draw the corresponding ogives. Pam O’Brien © 2012 Statistical Data Analysis Section 1 - Statistics Page: 1 of 2 4. For the tables of data in question 2 above calculate the a. 20th percentile b. 65th percentile 5. For the following sets of data calculate the mean, mode, median a. 35, 42, 56, 39, 38, 41, 40, 35, 43, 36 b. 11, 14, 7, 8, 12, 11, 11, 17, 9 c. 10.01, 12.56, 13.98, 15.21, 9.45, 11.22, 17.34, 15.34, 12.32, 21.89, 6. For the following sets of data calculate the range, the mean deviation, the semi-interquartile range and the standard deviation a. 35, 42, 56, 39, 38, 41, 40, 35, 43, 36 b. 11, 14, 7, 8, 12, 11, 11, 17, 9 7. Calculate a. The standard scores achieved in an exam with mean 59 and standard deviation 17 if the marks achieved were i. 68 ii. 79 iii. 41 b. The actual marks achieved in an exam with mean 48 and standard deviation 19 if the standard scores achieved were i. 1.0 ii. -0.65 iii. -2.1 c. Find the mean and standard deviation of exam grades if standard scores of 0.7 and 1.2 correspond to 65 and 42 respectively Pam O’Brien © 2012 Statistical Data Analysis Section 1 - Statistics Page: 2 of 2


