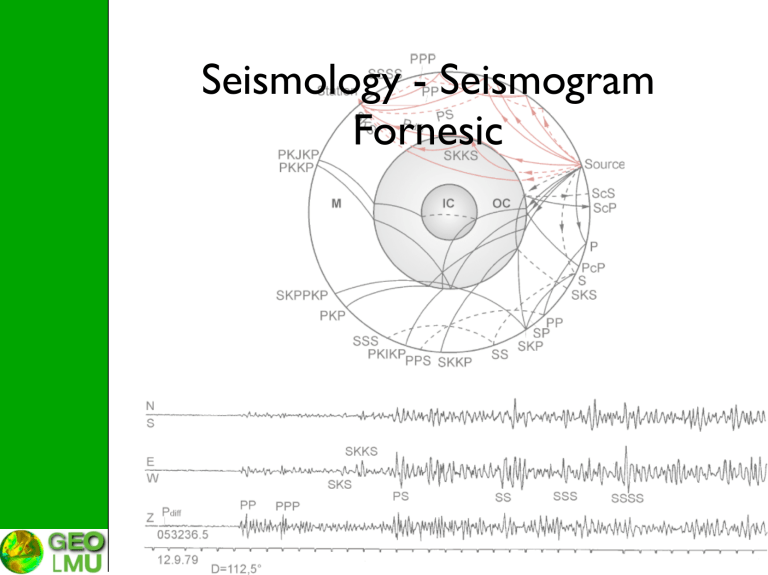
Seismology - Seismogram Fornesic Anatomy of Seismograms Frequency of Earthquakes Type Ml Observation Frequency Micro <2.0 not felt > 8.000 /day very weak 2.0-2.9 felt 1.000 /day weak 3.0-3.9 felt but no damage 49.000 /year small 4.0-4.9 only small damage 6.200 /year moderate 5.0-5.9 damage at certain buildings 800 /year strong 6.0-6.9 damage in a radius of 100 km 120 /year significant 7.0-7.9 sig. damage within a large area 18 /year large 8.0-8.9 sig. damage within several 100s km 1 /year very large > 9.0 radius of damage > 1000km within 20 years Anatomy of Seismograms Anatomy of Seismograms local EQ < 10 km Anatomy of Seismograms Anatomy of Seismograms local EQ < 100 km Anatomy of Seismograms Anatomy of Seismograms local EQ < 300 km Anatomy of Seismograms Anatomy of Seismograms local EQ < 50 km Anatomy of Seismograms local EQ < 50 km Explosion!! Anatomy of Seismograms Anatomy of Seismograms regional EQ < 2000 km Anatomy of Seismograms Anatomy of Seismograms teleseismic EQ > 12,000 km Anatomy of Seismograms Separation according to distance: Anatomy of Seismograms Separation according to distance: • local events: Δ < 600 km (150 km) Anatomy of Seismograms Separation according to distance: • • local events: Δ < 600 km (150 km) regional events: 600 km < Δ < 12,000 km Anatomy of Seismograms Separation according to distance: • • • local events: Δ < 600 km (150 km) regional events: 600 km < Δ < 12,000 km teleseismic events: Δ > 12,000 km Anatomy of Seismograms Separation according to distance: • • • local events: Δ < 600 km (150 km) regional events: 600 km < Δ < 12,000 km teleseismic events: Δ > 12,000 km Criterion for classification Anatomy of Seismograms Separation according to distance: • • • local events: Δ < 600 km (150 km) regional events: 600 km < Δ < 12,000 km teleseismic events: Δ > 12,000 km Criterion for classification ➪Duration!! Aufbau der Seismogramme Aufbau der Seismogramme Aufbau der Seismogramme Anatomy of Seismograms Why are they looking so different? Anatomy of Seismograms Why are they looking so different? • differences in propagation (direct, reflected, refracted, diffracted) Anatomy of Seismograms Why are they looking so different? • differences in propagation (direct, reflected, refracted, diffracted) • focal depth influences the overall shape of a seismogram significantly (depth phases, surface waves) Anatomy of Seismograms Local & regional events (Δ<10∘): Kulhanek, 1990 Anatomy of Seismograms Local & regional events (Δ<10∘): Kulhanek, 1990 Anatomy of Seismograms Local & regional events (Δ<10∘): Kulhanek, 1990 Anatomy of Seismograms phases (IASPEI): • • • • • • • • • • • • P: longitudinal wave (undae primae) K: longitudinal wave through outer core I: longitudinal wave through inner core S: transversal wave (undae secundae) T: wave partially propagating as acoustic wave in the ocean J: transversal wave trough inner core N: n-times reflected waves p/s (small): depth phases L: surface waves unspecified R: Rayleighwave Q: Lovewave G: (long period) global (mantel) Lovewave Aufbau der Seismogramme Phasenkonvention (crust - IASPEI): Aufbau der Seismogramme Phasenkonvention (crust - IASPEI): Aufbau der Seismogramme Phasenkonvention (near source - IASPEI): Anatomy of Seismograms Local & regional events (Δ<10∘): Anatomy of Seismograms Local & regional events (Δ<10∘): • • • • • Duration < 5 min seismogram complex (compared to 1 to 3 layers) dominant signal is Sg followed by waves with decreasing amplitude (Coda). Explosions may generate large Rayleighwaves order of arrival: Pg, Pb, Pn for ts-p < 20s Pn, Pb, Pg für ts-p < 25s “rule of thumb”: ts-p[s] · 8 = ∆ in [km] if Pg and Sg first, in in case of Pn and Sn first: ts-p[s] · 10 = ∆ Anatomy of Seismograms teleseismic events (Δ>10∘): Kulhanek, 1990 Anatomy of Seismograms teleseismic events (Δ>10∘): Kulhanek, 1990 Anatomy of Seismograms teleseismic events (Δ>10∘): • • • • • wave propagation mainly in mantel mantel less heterogenous than the crust large distances correspond with deeper penetration of waves into mantel surface waves are dominating the seismogram depending on focal depth ray parameter needs re-definition because of spherical symmetry Anatomy of Seismograms teleseismic events (Δ>10∘): Anatomy of Seismograms teleseismic events (Δ>10∘): Anatomy of Seismograms teleseismic events (Δ>10∘): Anatomy of Seismograms teleseismic events (Δ>10∘): Anatomy of Seismograms teleseismic events (Δ>10∘): Anatomy of Seismograms teleseismic events (Δ>10∘): Anatomy of Seismograms teleseismic events (Δ>10∘): Anatomy of Seismograms teleseismic events (Δ>10∘): Anatomy of Seismograms Caustic?: Anatomy of Seismograms Caustic?: Anatomy of Seismograms Analysis of Seismograms “... jede Zacke, jede Zunge zu erklären ...” ‘... to explain each wiggle ...’ Emil Wiechert Analysis of Seismograms Analysis of Seismograms Tools - single station • • • • digital filtering will improve SNR phase identification➪using simple relations (tS-P) or better travel time tables it is in principle possible to estimate the distance and the depth polarization analysis ( 3C-seismometers) may lead to azimuth nowadays only rarely done BUT: agencies are not able to perform a detailed analysis! Analysis of Seismograms 1. Are you NEAR (D < 20°) or TELESEISMIC (D > 20°)? Criteria: • Frequencies on SP records f ≥ 1 Hz f ≤ 1 Hz • Amplitudes on LP records not or weaker large, also for later phases • Record duration < 20 min > 20 min (for magnitudes < 5; may be longer for strong earthquakes; see Fig. 1.2) 2. Is your D < 100° or D > 100° ? Criteria: • Surface wave max.after P arrival < 45 ± 5 min or > 45 ± 5 min (Table 5 in DS 3.1) • Record duration on LP records < 1.5 hours or > 1.5 hours (may be larger for very strong earthquakes; see Fig. 1.2) 3. Are you SHALLOW or DEEP (> 70 km)? Criteria: • Surface waves on LP records strong weak or none • Depth phases usually not clear well separated and often clear • Waveforms usually more complex more impulsive 4. Is the first strong horizontal arrival S or SKS ? Criteria: • Time difference to P < 10 ± 0.5 min ≈ 10 ± 0.5 min • Polarization large horiz. A in R and/or T in R only Warning ! If the first strong horizontal arrival follows P after ≈ 10 ± 0.5 min it may be SKS. Check polarization! (see Fig. 11.14). Misinterpreting SKS as S may yield D estimates up to 20° too short. Look also for later multiple S arrivals (SP, SS, SSS) with better D control. Analysis of Seismograms Network - Localization: • Geiger method: Analysis of Seismograms Network - Localization: • Geiger method: How much information is needed Analysis of Seismograms Network - Localization: • Geiger method: How much information is needed ∆ = vc·(t - T0) ➪Estimation of origin time Analysis of Seismograms Network - Localization: Wadati-Diagram: Estimation of origin time and vp/vs (vp/vs)-1 Analysis of Seismograms Network - Localization: Epicenter Analysis of Seismograms Network - Localization: Epicenter Analysis of Seismograms Network - Localization: Epicenter Analysis of Seismograms Network - Localization: Epicenter Analysis of Seismograms Network - Localization: Epicenter Analysis of Seismograms Network - Localization: Epicenter Analysis of Seismograms Network - Localization: Epicenter Analysis of Seismograms Network - Localization: Epicenter Analysis of Seismograms Network - Localization: Depth h Analysis of Seismograms Network - Localization: • non linear inversion: Analysis of Seismograms Network - Magnitude: Analysis of Seismograms Network - Magnitude: Leading equation of all magnitudes: M = log(Ad/T)max + σ(Δ, h) + Cr + CS. with: • • • Ad ground displacement measured at period T σ(Δ, h) calibration factor, which refers to the distance (geometrical spreading) and absorption (intrinsic and scattering) dependent damping of the amplitude. In most cases the calibration refers to a reference amplitude of an earthquake with a fixed magnitude (e.g., 3 or 0): σ(Δ, h) = -log A0(Δ, h) directivity (regional) of the source (Cr) and station correction (Cs) Analysis of Seismograms Network - Magnitude: General steps: Magnitudes can be determined on the basis of Eq. (1) by reading (A/T)max for any body wave (e.g., P, S, Sg, PP) or surface waves (LQ or Lg, LR or Rg) for which calibration functions for either vertical (V) and/or horizontal (H) component records are available. If the period being measured is from a seismogram recorded by an instrument whose response is already proportional to velocity, then (Ad/T)max = Avmax/2π, i.e., the measurement can be directly determined from the maximum trace amplitude of this wave or wave group with only a correction for the velocity magnification. In contrast, with displacement records one may not know with certainty where (A/T)max is largest in the displacement waveform. Sometimes smaller amplitudes associated with smaller periods may yield larger (A/T)max. In the following we will always use A for Ad, if not otherwise explicitely specified. • the trace amplitude B of a seismic signal on a record is defined as its largest peak (or trough) deflection from the baseline of the record trace; • for many phases, surface waves in particular, the recorded oscillations are more or less symmetrical about the zero line. B should then be measured either by direct measurement from the base-line or - preferably - by halving the peak-totrough deflection (Figs. 3.9 a and c - e). For phases that are strongly asymmetrical (or clipped on one side) B should be measured as the maximum deflection from the base-line (Fig. 3.9 b); • the corresponding period T is measured in seconds between those two neighboring peaks (or troughs) - or from (doubled!) trace crossings of the base-line - where the amplitude has been measured (Fig. 3.9); • the trace amplitudes B measured on the record should be converted to ground displacement amplitudes A in nanometers (nm) or some other stated SI unit, using the A-T response (magnification) curve Mag(T) of the given seismograph (see Fig.3.11); i.e., A = B /Mag(T). (Note: In most computer programs for the analysis of digital seismograms, the measurement of period and amplitude is done automatically after marking the position on the record where A and T should be determined); Analysis of Seismograms Network - Magnitude: General steps: • amplitude and period measurements from the vertical component (Z = V) are most important. If horizontal components (N - north-south; E - east-west) are available, readings from both records should be made at the same time (and 2 2 noted or reported separately) so that the amplitudes can be combined vectorially, i.e., AH = √ (AN + AE ) ; • when several instruments of different frequency response are available (or in the case of the analysis of digital broadband records filtered with different standard responses), Amax and T measurements from each should be reported separately and the type of instrument used should be stated clearly (short-, medium- or long-period, broadband, Wood-Anderson, etc., or related abbreviations given for instrument classes with standardized response characteristics; see Fig. 3.11 and Tab. 3.1). For this, the classification given in the old Manual of Seismological Observatory Practice (Willmore 1979) may be used; • broadband instruments are preferred for all measurements of amplitude and period; • note that earthquakes are often complex multiple ruptures. Accordingly, the time, tmax , at which a given seismic body wave phase has its maximum amplitude may be quite some time after its first onset. Accordingly, in the case of P and S waves the measurement should normally be taken within the first 25 s and 40-60 s, respectively, but in the case of very large earthquakes this interval may need to be extended to more than a minute. For subsequent earthquake studies it is also essential to report the time tmax (see Fig. 3.9). • for teleseismic (Δ > 20°) surface waves the procedures are basically the same as for body waves. However, (A/T)max in the Airy phase of the dispersed surface wave train occurs much later and should normally be measured in the period range between 16 and 24 s although both shorter and longer periods may be associated with the maximum surface wave amplitudes (see 2.3). Analysis of Seismograms Network - Magnitude: General steps • note that in displacement proportional records (A/T)max may not coincide in time with Bmax. Sometimes, in dispersed surface wave records in particular, smaller amplitudes associated with significantly smaller periods may yield larger (A/T)max. In such cases also Amax should be reported separately. In order to find (A/T)max on horizontal component records it might be necessary to calculate A/T for several amplitudes on both record components and select the largest vectorially combined value. In records proportional to ground velocity, the maximum trace amplitude is always related to (A/T)max. Note, however, that as compared to the displacement amplitude Ad the velocity amplitude is Av = Ad 2π/T. • if mantle surface waves are observed, especially for large earthquakes (see 2.3), amplitudes and periods of the vertical and horizontal components with the periods in the neighborhood of 200 s should also be measured; • on some types of short-period instruments (in particular analog) with insufficient resolutions it is not possible to measure the period of seismic waves recorded from nearby local events and thus to convert trace deflections properly to ground motion. In such cases magnitude scales should be used which depend on measurements of maximum trace amplitudes only; • often local earthquakes will be clipped in (mostly analog) records of high-gain short-period seismographs with insufficient dynamic range. This makes amplitude readings impossible. In this case magnitude scales based on record duration (see 3.2.4.3) might be used instead, provided that they have been properly scaled with magnitudes based on amplitude measurements. Analysis of Seismograms Network - Magnitude: Analysis of Seismograms Network - Magnitude: Local-Magnitude (period @ 1 s; Δ < 600 km): Ml = log Amax - log A0 Note: in this case the amplitude is NOT divided by the period of the signal. The Ml is measured at the Lg waves of the seismogram. Analysis of Seismograms Network - Magnitude: Distance corrections: Analysis of Seismograms Network - Magnitude: Problem: saturation of the magnitudes Analysis of Seismograms Network - Magnitude: Better: estimation of the seismic moment Definition: M0 = µD A Estimated via: 3 M0 = 4π ∆ ρ v p,s u0/Rp,sθ,ϕ with: • u0 spectrale amplitude of ground displacement at frequency 0 (spectral plateau) • vp,s P- or S-wave speed • ∆ hypo-central distance • Rp,sθ,ϕ radiation pattern and free surface correction • ρ density of the medium Note: only valid in homogenous half space Analysis of Seismograms Network - Magnitude: Definition Moment-Magnitude: Mw = 2/3 (log M0 9.1) Analysis of Seismograms Network - Source Mechanism: Types of sources Analysis of Seismograms Network - Focal Mechanism: Analysis of Seismograms Network - Moment Tensor: Seismogram might be written as: un(x,t) = Mpq(ξ,τ)∗Gnp;q(ξ,x,t); with: Mpq(ξ,τ) ≜ moment-tensor (incl. “source time function”) Gnp;q(ξ,x,t) ≜ Greenʼs function of elementary source (couples) Analysis of Seismograms Network - Moment Tensor: Analysis of Seismograms Network - Moment Tensor: Analysis of Seismograms Network - Moment Tensor: Der moment tensor might be written as: M = Misotrop + Mdeviatoric with Mdeviatoric = MDC + MCVLD Streuung und Quell-Mechanismus Streuung und Quell-Mechanismus Streuung und Quell-Mechanismus Streuung und Quell-Mechanismus Streuung und Quell-Mechanismus Streuung und Quell-Mechanismus Streuung und Quell-Mechanismus Streuung und Quell-Mechanismus Streuung und Quell-Mechanismus Streuung und Quell-Mechanismus Streuung und Quell-Mechanismus LongPeriod/ Explosion LongPeriod/ Explosion LongPeriod/ Explosion LongPeriod/ Explosion Felt Earthquakes in Bavaria (1300 - present) Netzwerk Design Goal: state wide monitoring of EQ Ml>2.0 Netzwerk Design 641 Goal: state wide monitoring of EQ Ml>2.0 478 Seismicity in Bavarian Alps 69 Seismicity in Bavarian Alps 69 Hochstaufen 1982: -30km 2004: -5km 1981: -20km 2003: -23km 2008: -10km 2008: -30km 1997: 2007: -10km 70 Hochstaufen (2002-2011) 1713 earhtquakes in 10 years !! 71 earthquakes (Ml ≥ 0.3) - rain (2002-2008) 72 Rate - State & Diffusion Setting at active plate boundaries Intraplate setting 14. Januar 2014 73 Rate - State & Diffusion & ???? 14. Januar 2014 74 Deformation of the Molasse 10˚ 12˚ 14˚ 50˚ 50˚ !"#ï"$%&'()*+,-( 48˚ 48˚ 10˚ Kommission für Erdmessung und Glaziologie - BADW 12˚ 14˚ bay. Landesamt für Vermessung und Geoinformation 14. Januar 2014 75 induced earthquakes 1982: -30km 2004: -5km 1981: -20km 2003: -23km 2008: -10km 2008: -30km 1997: 2007: -10km 76 Sparse Network DGG/EAGE 14. March 2014 77 Geothermie Unterhaching felt earthquakes > 400 induced EQs 78 Location Using Sparse Networks DGG/EAGE 14. March 2014 79 Location Using Sparse Networks DGG/EAGE 14. March 2014 79 Improving Locations - HypoDD drkij = (t ki − t kj )obs − (t ki − t kj )cal Requires: slowness sik = sjk If not, the local slowness has to be taken into account: i j j i ∂t ∂t ij k k drk = Δm − Δm ∂m ∂m To be solved iteratively! Waldhauser and Ellsworth (2000) DGG/EAGE Different weights applied during different inversion steps 14. March 2014 80 The Use of HypoDD DGG/EAGE 14. March 2014 81 Improving Onsets - Waveform Similarities Deichmann and Garcia-Fernandez (1992) DGG/EAGE 14. March 2014 82 Master-Event Technique DGG/EAGE 14. March 2014 83 Master-Event Technique DGG/EAGE 14. March 2014 83 Master-Event Technique DGG/EAGE 14. March 2014 83 MAGS - ʻMaster-Slaveʼ Re-Location DGG/EAGE 14. March 2014 84 MAGS - ʻMaster-Slaveʼ Re-Location ~ 25° ~ 45° ~ 70° Coherence attributes (Lüschen et al. 2011) DGG/EAGE 14. March 2014 84
