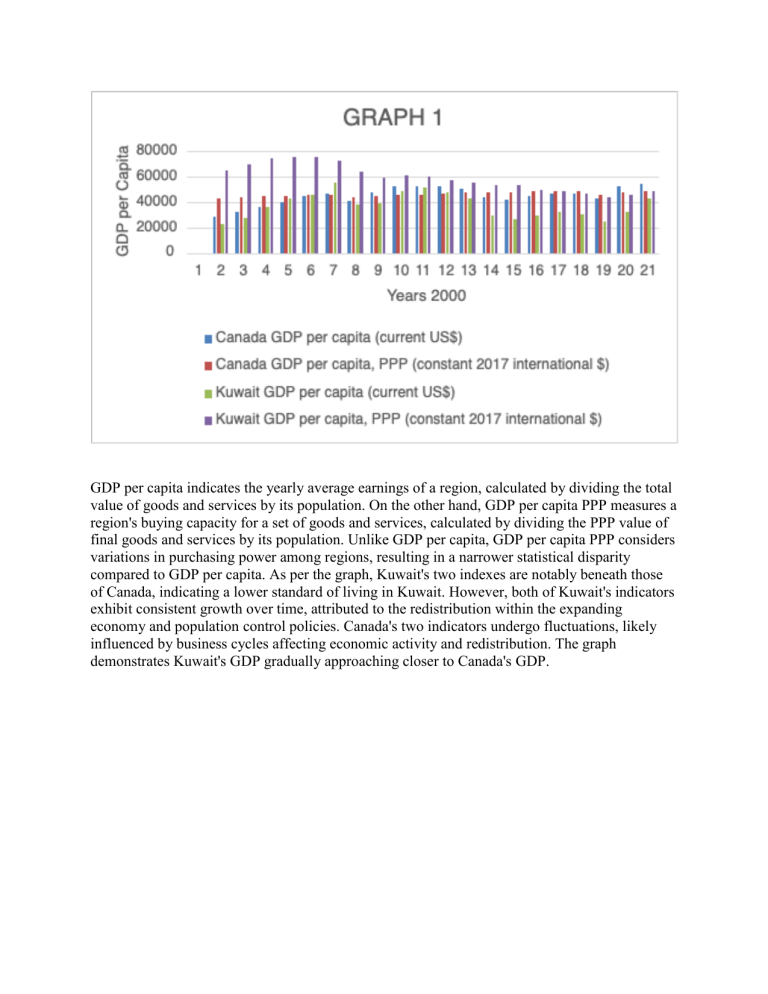
GDP per capita indicates the yearly average earnings of a region, calculated by dividing the total value of goods and services by its population. On the other hand, GDP per capita PPP measures a region's buying capacity for a set of goods and services, calculated by dividing the PPP value of final goods and services by its population. Unlike GDP per capita, GDP per capita PPP considers variations in purchasing power among regions, resulting in a narrower statistical disparity compared to GDP per capita. As per the graph, Kuwait's two indexes are notably beneath those of Canada, indicating a lower standard of living in Kuwait. However, both of Kuwait's indicators exhibit consistent growth over time, attributed to the redistribution within the expanding economy and population control policies. Canada's two indicators undergo fluctuations, likely influenced by business cycles affecting economic activity and redistribution. The graph demonstrates Kuwait's GDP gradually approaching closer to Canada's GDP. Gross Domestic Product (GDP) represents the overall production or value of final goods and services within a state during a specific period. GDP growth signifies the enhancement of GDP and serves as an indicator of economic health. Likewise, the growth in GDP per capita indicates advancements in the annual average income and living standards. According to Graph 2, Kuwait experienced significantly higher GDP and GDP per capita growth compared to Canada in the early years of the 21st century. At that time, Kuwait, being in a developmental phase, demonstrated swifter growth due to increased demand for infrastructure and expanding exports, while Canada, possessing a more established and mature economy, had historically slower growth. Both countries' indicators followed the typical pattern of the business cycle, undergoing periodic fluctuations every few years. Additionally, external factors such as the global pandemic had a substantial impact on both nations. In 2019, Kuwait recorded its lowest annual GDP growth, but it rebounded in 2021, nearly aligning with Canada's GDP growth. Consumer price indicates the overall price level that consumers encounter when purchasing a collection of goods and services essential to their living standards. This encompasses taxes, and imports, and reflects the affordability for households. On the other hand, the GDP deflator illustrates the alterations in the price of all domestically produced goods and services, encompassing exports as well. It signifies the overall price level of all products within a country. Unemployment denotes the percentage of people without jobs within the workforce. The vulnerable employment rate represents the proportion of jobs with low income and instability among the working-age population. It encompasses a wider range of job distributions based on gender, educational attainment, age, and other factors. This measure offers perspectives on the fact that Kuwait maintained an unemployment rate of 6%, while Canada's stood at approximately 7%. This observation might indicate that Kuwait potentially offers more employment opportunities compared to Canada. Concerning the vulnerable employment rate, it indicates an improvement in Kuwait's living standards, whereas Canada's situation remains relatively stable. living standards of the population. Life expectancy at birth represents the anticipated lifespan of a newborn, serving as an indicator of societal aging trends and advancements in living standards. Both countries have witnessed an increase in life expectancy at birth, even amid the pandemic, indicating their effective responses to this challenge. However, while this signifies an improvement in living standards, it also implies an increasing strain on government spending for pensions. Moreover, women tend to have a longer life expectancy than men, a phenomenon that may be influenced by scientific factors. As seen Canada surpasses the life expectancy over the last 20 years, while Kuwait remains it’s average. One notable change is that Kuwait is seen to have lower life expectancy in 2019, which would’ve been the outburst of the Pandemic. We can observe just how much of an impact that has made on their Life Expectancy measure and we can now consider that it may be demographics related to other indicators, like access to healthcare, GDP, and more.


