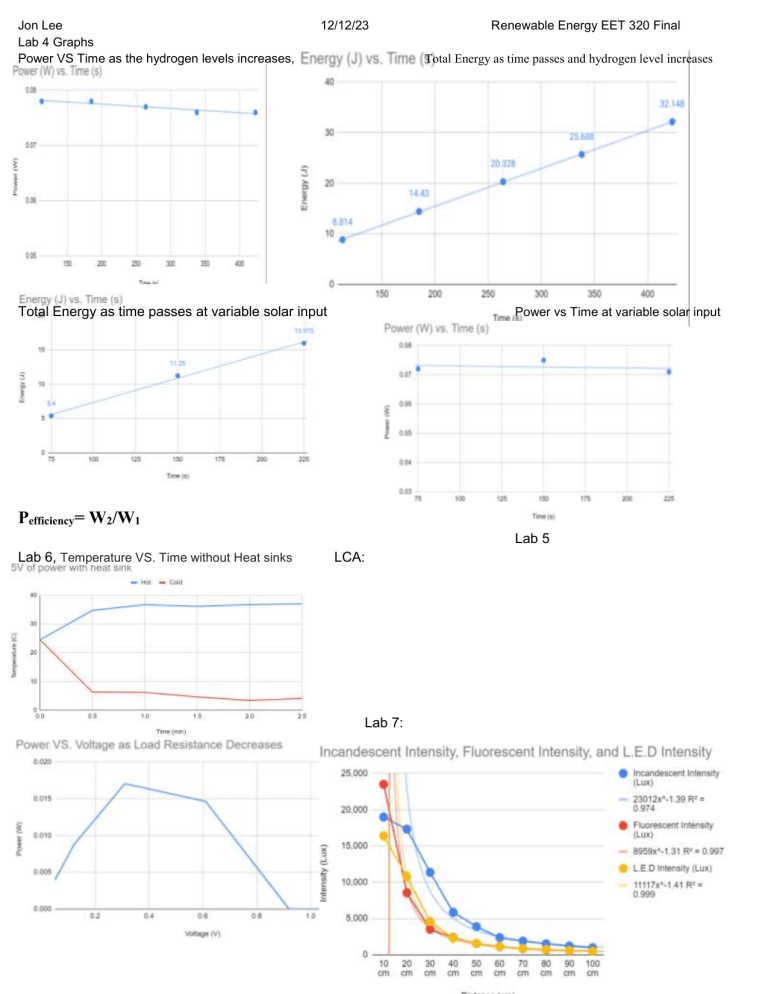
Jon Lee Lab 4 Graphs Power VS Time as the hydrogen levels increases, 12/12/23 Renewable Energy EET 320 Final Total Energy as time passes and hydrogen level increases Total Energy as time passes at variable solar input Power vs Time at variable solar input Pefficiency= W2/W1 Lab 5 Lab 6, Temperature VS. Time without Heat sinks LCA: Lab 7: Internal Resistance formula for V over I graph is -r = (y2 - y1)/(x2 - x1), Wind Power Equation 1/2CpAV^3 Simple resistive load I-V Curve Formula V = IR or I = (1/R)V. P = V*I. MAXIMUM POWER POINT FORMULA FOR I-V = Rm = Vm/Im…. Vm and Im are the V and I at the MPP Lab 4 Hybrid power formulas -Calculate the power efficiency (Poutput/Pinput = I2V2/I1V1)
