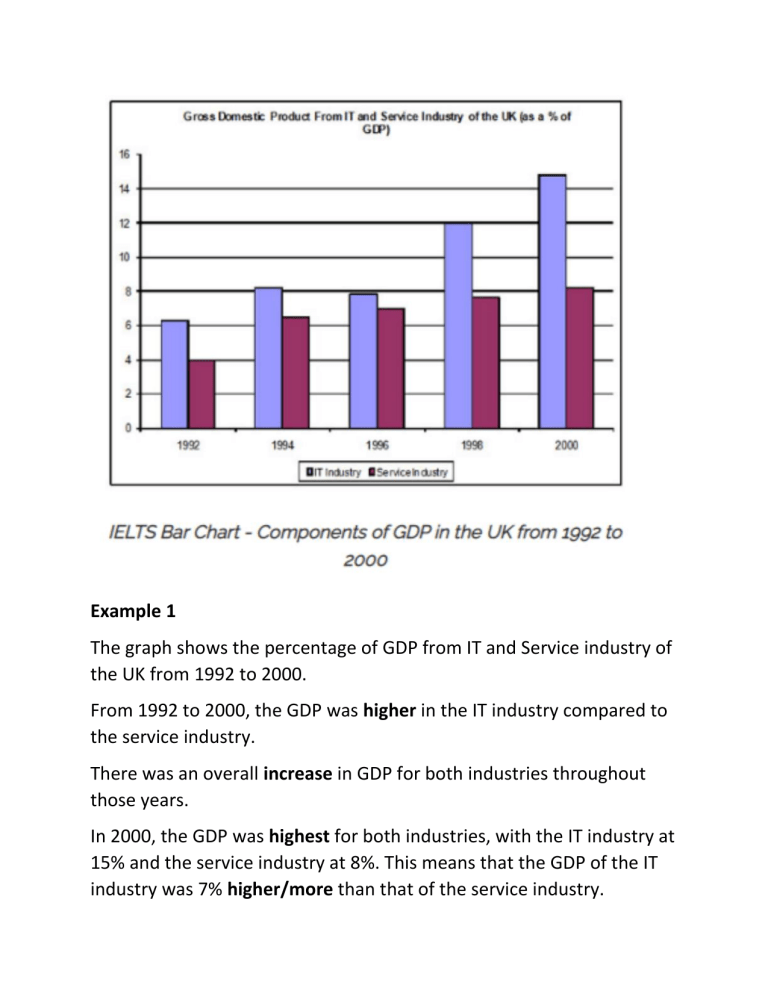
Example 1 The graph shows the percentage of GDP from IT and Service industry of the UK from 1992 to 2000. From 1992 to 2000, the GDP was higher in the IT industry compared to the service industry. There was an overall increase in GDP for both industries throughout those years. In 2000, the GDP was highest for both industries, with the IT industry at 15% and the service industry at 8%. This means that the GDP of the IT industry was 7% higher/more than that of the service industry. The difference between the two industries was lowest in 1996, with a difference of less than 1%. However, in 2000, compared to 1992, the GDP of both industries had doubled. In 1992, the GDP of the IT industry was approximately 6%, but by 2000 it had increased to 15%. Similarly, the GDP of the service industry increased from 4% to 8% during that period. Example 2 The graph shows the percentage of GDP from IT and Service industry of the UK from 1992 to 2000. In the year 1992, the GDP of the IT industry was about 6% while the GDP of the service industry was 4%. In the year 1994, the GDP of the IT industry was 8% while the GDP of the service industry was about 6%. In the year 1996, the GDP of the IT industry was about 8% while the GDP of the service industry was about 7%. In the year 1998, the GDP of IT industry was 12% while the GDP of service industry was about 7.5%. In the year 2000, the GDP of IT industry was 15% while the GDP of service industry was about 8%. The GDP of both industries was lowest in the year 1992. The GDP of both industries was highest in the year 2000. The GDP of the IT industry was 7% higher/more than that of the service industry in 2000. The GDP of the IT industry was about 2% higher/more than that of the service industry in 1992. The graph shows the percentage of the working-age population broken down by age in Ontario in 2001 and 2006. The percentage of people working in the age group 15-19 years is same/equal (10%) in 2001 and 2006. Percentage of the people working in the age group 20-24 was 9% in 2001 and 9.5% in 2006. Percentage of the people working in the age group 25-29 was 9.2% in 2001 and 8.9% in 2006. (ިމ ޮގ ަތ ްށ ެދ ްނ ުހ ިރ ޭއ ްޖ ްގ ޫރ ްޕ ަތ ަކ ްށ ެވ ްސ ިލ ެޔލ The working-age group with the highest percentage in 2001 is/was 3539 years. The working-age group with the highest percentage in 2006 is/was 4044 years. The working age group with the least percentage in 2001 and 2006 is 60-64 years.


