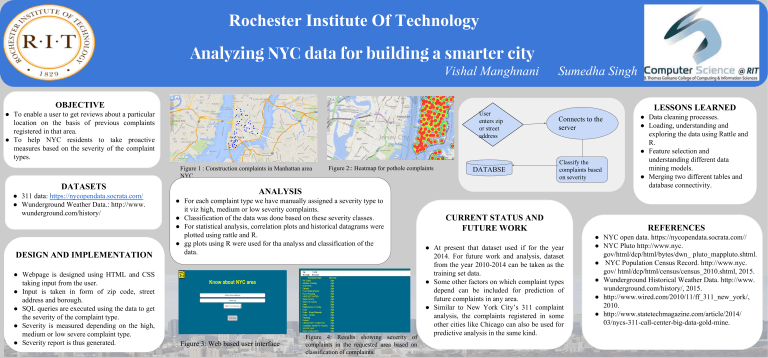
Rochester Institute Of Technology Analyzing NYC data for building a smarter city Vishal Manghnani Sumedha Singh OBJECTIVE User enters zip or street address ● To enable a user to get reviews about a particular location on the basis of previous complaints registered in that area. ● To help NYC residents to take proactive measures based on the severity of the complaint types. Figure 1 : Construction complaints in Manhattan area NYC DATASETS ● 311 data: https://nycopendata.socrata.com/ ● Wunderground Weather Data.: http://www. wunderground.com/history/ DESIGN AND IMPLEMENTATION ● Webpage is designed using HTML and CSS taking input from the user. ● Input is taken in form of zip code, street address and borough. ● SQL queries are executed using the data to get the severity of the complaint type. ● Severity is measured depending on the high, medium or low severe complaint type. ● Severity report is thus generated. Figure 2:: Heatmap for pothole complaints DATABSE LESSONS LEARNED Connects to the server Classify the complaints based on severity ANALYSIS ● For each complaint type we have manually assigned a severity type to it viz high, medium or low severity complaints. ● Classification of the data was done based on these severity classes. ● For statistical analysis, correlation plots and historical datagrams were plotted using rattle and R. ● gg plots using R were used for tha analyss and classification of the data. Figure 3: Web based user interface Figure 4: Results showing severity of complaints in the requested area based on classification of complaints. CURRENT STATUS AND FUTURE WORK ● At present that dataset used if for the year 2014. For future work and analysis, dataset from the year 2010-2014 can be taken as the training set data. ● Some other factors on which complaint types depend can be included for prediction of future complaints in any area. ● Similar to New York City’s 311 complaint analysis, the complaints registered in some other cities like Chicago can also be used for predictive analysis in the same kind. ● Data cleaning processes. ● Loading, understanding and exploring the data using Rattle and R. ● Feature selection and understanding different data mining models. ● Merging two different tables and database connectivity. REFERENCES ● NYC open data. https://nycopendata.socrata.com// ● NYC Pluto http://www.nyc. gov/html/dcp/html/bytes/dwn_ pluto_mappluto.shtml. ● NYC Population Census Record. http://www.nyc. gov/ html/dcp/html/census/census_2010.shtml, 2015. ● Wunderground Historical Weather Data. http://www. wunderground.com/history/, 2015. ● http://www.wired.com/2010/11/ff_311_new_york/, 2010. ● http://www.statetechmagazine.com/article/2014/ 03/nycs-311-call-center-big-data-gold-mine.

