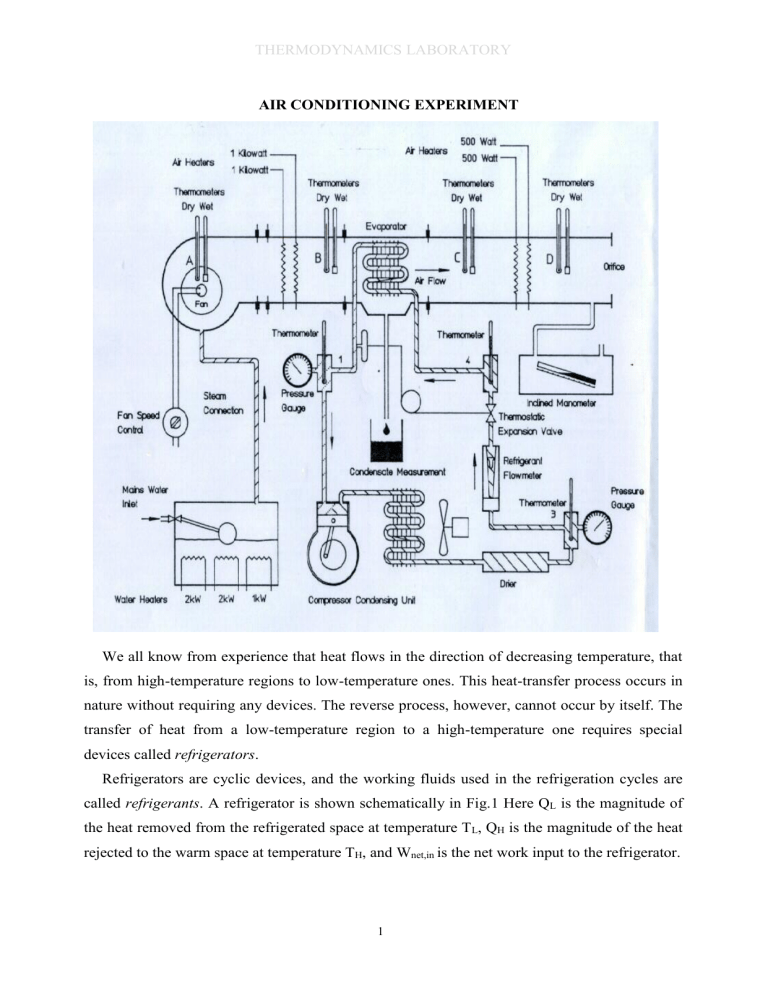
THERMODYNAMICS LABORATORY AIR CONDITIONING EXPERIMENT We all know from experience that heat flows in the direction of decreasing temperature, that is, from high-temperature regions to low-temperature ones. This heat-transfer process occurs in nature without requiring any devices. The reverse process, however, cannot occur by itself. The transfer of heat from a low-temperature region to a high-temperature one requires special devices called refrigerators. Refrigerators are cyclic devices, and the working fluids used in the refrigeration cycles are called refrigerants. A refrigerator is shown schematically in Fig.1 Here QL is the magnitude of the heat removed from the refrigerated space at temperature TL, QH is the magnitude of the heat rejected to the warm space at temperature TH, and Wnet,in is the net work input to the refrigerator. 1 THERMODYNAMICS LABORATORY Another device that transfers heat from a lowtemperature medium to a high-temperature one is the heat pump. Refrigerators and heat pumps are essentially the same devices; they differ in their objectives only. The objective of a refrigerator is to maintain the refrigerated space at a low temperature by removing heat from it. Discharging this heat to a higher-temperature medium is merely a necessary part of the operation, not the purpose. The objective of a heat pump, however, is to maintain a heated space at a high temperature. This is accomplished by absorbing heat from a low-temperature source, Figure 1. The objective of a refrigerator is to remove heat (QL) from the cold medium; the objective of a heat pump is to supply heat (QH) to a warm medium such as well water or cold outside air in winter, and supplying this heat to a warmer medium such as a house. The performance of refrigerators and heat pumps is expressed in terms of the coefficient of performance (COP), defined as COPR QL h h4 Cooling .effect 1 Work .input Wnet ,in h2 h1 COPHP h h3 QH Heating .effect 2 Work .input Wnet ,in h2 h1 The vapor-compression refrigeration cycle is the most widely used cycle for refrigerators, air-conditioning systems, and heat pumps. It consists of four processes: 1-2 Isentropic compression in a compressor 2-3 Constant-pressure heat rejection in a condenser 3-4 Throttling in an expansion device 4-1 Constant-pressure heat absorption in an evaporator 2 THERMODYNAMICS LABORATORY Figure 2. Schematic and T-s diagram for the ideal vapor-compression refrigeration cycle. In an ideal vapor-compression refrigeration cycle, the refrigerant enters the compressor at state 1 as saturated vapor and is compressed isentropically to the condenser pressure. The temperature of the refrigerant increases during this isentropic compression process to well above the temperature of the surrounding medium. The refrigerant then enters the condenser as superheated vapor at state 2 and leaves as saturated liquid at state 3 as a result of heat rejection to the surroundings. The temperature of the refrigerant at this state is still above the temperature of the surroundings. The saturated liquid refrigerant at state 3 is throttled to the evaporator pressure by passing it through an expansion valve or capillary tube. The temperature of the refrigerant drops below the temperature of the refrigerated space during this process. The refrigerant enters the evaporator at state 4 as a low-quality saturated mixture, and it completely evaporates by absorbing heat from the refrigerated space. The refrigerant leaves the evaporator as saturated vapor and reenters the compressor, completing the cycle. In a household refrigerator, the tubes in the freezer compartment where heat is absorbed by the refrigerant serves as the evaporator. The coils behind the refrigerator, where heat is dissipated to the kitchen air, serve as the condenser. Remember that the area under the process curve on a T-s diagram represents the heat transfer for internally reversible processes. The area under the process curve 4-1 represents the heat absorbed by the refrigerant in the evaporator, and the area under the process curve 2-3 represents the heat rejected in the condenser. A rule of thumb is that the COP improves by 2 to 4 percent for each ˚C the evaporating temperature is raised or the condensing temperature is lowered. 3 THERMODYNAMICS LABORATORY Figure 3. The P-h diagram of an ideal vapor-compression refrigeration cycle Another diagram frequently used in the analysis of vapor-compression refrigeration cycles is the P-h diagram, as shown in Fig. 3. On this diagram, three of the four processes appear as straight lines, and the heat transfer in the condenser and the evaporator is proportional to the lengths of the corresponding process curves. 1. OBJECTIVE: Air Conditioning, which may be described as the control of the atmosphere so that a desired temperature, humidity, distribution and movement is achieved, is a rapidly expanding activity throughout the world. The objective of this experiment is to observe four basic psychrometric processes which are heating, cooling, humidification and dehumidification in an air conditioning unit. The air velocity, dry bulb temperature, relative humidity and the amount of water added/removed will be measured to check the mass and energy balances of these processes. 2. INTRODUCTION: Applications for air conditioning are frequently encountered in homes, hospitals, public meeting places, mines, shops, offices, factories, land, air and sea transport, but there are numerous other applications in which human comfort is not the prime consideration. These include textile and printing industries, computers, laboratories, photographic and pharmaceutical industries, manufacture, inspection and storage of sensitive equipment, horticulture, animal husbandry, food storage and many others. Air conditioning plants usually consist of a number of components (e.g. fans, filters, heat exchangers, humidifiers, etc.) enclosed in a sheet metal casing. Intake to the plant is usually from a clean external atmosphere (plus, in some cases, air recirculated from the building) and delivery from the plant is via ducting to suitable distribution points. 4 THERMODYNAMICS LABORATORY 2.1. Components: Filters Coarse - usually wire mesh. To remove insects, leaves and other large airborne particles. Fine - usually paper or viscous type. To remove most of the airborne dust. Funs:are required to cause the air movement and to make good the pressure drop due to the duct and system resistances. Heat Exchangers: which usually are finned on the air side, are needed to increase or decrease the air temperature. Heaters may use steam, hot water or electricity as the heating medium. Coolers may be supplied with chilled water or may be of the direct expansion type in which liquid refrigerant boils at a low temperature. Humidifiers are used to increase the moisture content of the air. Water may be sprayed directly into the air, may be evaporated from a moist surface, or alternatively, steam may be injected into the air. Dehumidifiers are used to reduce the moisture content of the air. This is usually achieved by cooling the air below its dew point so that surplus moisture is precipitated. Sometimes hygroscopic materials are used to achieve dehumidification, but, of course, these require regeneration. Eliminators are specially shaped baffles through which the air flows and which remove entrained water droplets from the air stream. Mixers are employed to blend two streams of air to achieve a desired condition and/or economy. Instruments and Controls are needed to sense the condition of the air at various stations, and to vary the output of the components to bring about the desired final condition. Boiler for humidification and/or for the air heaters. Refrigeration Plant for the air coolers/dehumidifiers. Hygrometers are instruments for measuring the moisture content of the atmosphere. There are many types of hygrometer. The Air Conditioning Laboratory Unit employs the well- known wet and dry bulb type hygrometer for determining air condition. 2.2. Comfort Conditions: A man rejects up to about 400 W (according to his level of activity) to the atmosphere. This heat loss is accounted for by a combination of convection and radiation from his body surfaces, and evaporation of moisture from his lungs and skin. As the air temperature increases, the amount of heat which can be rejected by convection and radiation decreases, thus the evaporation component must increase. If the relative humidity of the atmosphere is already high, evaporation will be sluggish, skin surfaces become wet, and the person feels uncomfortable. In hot and humid conditions, 5 THERMODYNAMICS LABORATORY personnel are quickly exhausted and are unable to maintain vigorous activity. In addition, these conditions favour the growth of moulds and fungus -some of which cause skin ailments. Very low humidities on the other hand, cause rapid evaporation from the lungs, throat, eyes, skin and nasal passages and these can also cause discomfort. 2.3. Human Comfort: The primary function of air conditioning is to modify the state of the air for human comfort. The industrial air conditioning meets the temperature and humidity requirements of an industrial or scientific process. In comfort air conditioning, it is necessary to control simultaneously the temperature, relative humidity, cleanliness and distribution of air to meet the comfort requirements of the occupants. According to the comfort chart given by the American Society of Heating, Refrigeration and Air conditioning Engineers (ASHRAE), comfort conditions can be obtained at 20-23°C dry bulb temperature with 50 ± 20% relative humidity in winter and 24-27°C dry bulb temperature with 50 ± 20% relative humidity in summer. In order to maintain these requirements, the state of the air is modified in an air conditioning apparatus such that the varying summer and winter loads are balanced. 3. BASIC PSYCHROMETRY TERMINOLOGY Humidity: One of the most fundamental terms of psychrometry, humidity refers to the water content of air. Often, to find the humidity, specific and relative humidity are calculated. Specific humidity (𝜔): The ratio of water vapor mass to the dry air mass. This is also called absolute humidity or humidity ratio; mw ma Relative humidity (Φ): The ratio of partial pressure of water vapor in air to the saturation pressure of water at the given temperature; Pw Pw ,sat Relative humidity is usually expressed as percentage. When the relative humidity of air is 100%, then the air is saturated and cannot hold any more water vapor. If saturated air is 6 THERMODYNAMICS LABORATORY further cooled (thus lowering the saturation pressure of water vapor), then the water will start to condense or freeze, depending on the temperature. Dry Bulb temperature (𝑇𝑑𝑏): The temperature that can be measured by thermometer or a thermocouple. Wet Bulb Temperature (𝑇𝑤𝑏): Temperature measured when the tip of the thermometer (or any other temperature measuring device) is wetted. For unsaturated moist air, the measured value is less than dry bulb temperature, with the difference being proportional to the relative humidity. In practice, 𝑇𝑤𝑏 is assumed to be equal to adiabatic saturation temperature, 𝑇𝑠𝑎𝑡, which would be reached if moisture is added in an adiabatic process until the air becomes saturated. Thus, 𝑇𝑤𝑏 ≅ 𝑇𝑠𝑎𝑡. Psychrometric Chart: A chart to determine all properties of moist air when two of these properties are known. A psychrometric chart is drawn for a given elevation (or in other terms, pressure). 3.2. Psychrometric Processes The four basic psychrometric processes are sensible heating, sensible cooling, humidification and dehumidification. These four processes are drawn on the psychrometric chart as seen in Fig 4. Figure 4. Basic psychrometric processes. During sensible heating and sensible cooling, there is no change in the amount of water vapor; therefore specific humidity remains constant. However, dry and wet bulb temperatures and therefore, enthalpy change, since there is energy transfer. Relative humidity also changes since the saturation pressure of water will change due to temperature change. Humidification is the process of adding water vapor to the air. It increases the specific 7 THERMODYNAMICS LABORATORY and relative humidities, wet bulb temperature and enthalpy. Dry bulb temperature may or may not change, depending on whether there is a temperature difference between the air and vapor. Dehumidification, as the name suggests, is the reverse process of humidification; removal of water from air. Usually, dehumidification is achieved by cooling the air below its dew point temperature but absorbing of moisture by using a desiccant (a drying agent), such as silica gel is alsoopossible. These four basic processes can be combined when needed. Figure 5 shows these combined processes. Figure 5. Combined psychrometric processes. Process 1-6 is heating with humidification. This is achieved by spraying water at a higher dry bulb temperature than the air. Process 1-7 is heating with dehumidification. This could be achieved by heating the flowing air over a desiccant. Process 1-8 is cooling with humidification. This is similar to heating with humidification, with the only difference being the temperature of sprayed water. This process is used in air washers, the water sprays used in outdoor cafés to achieve human comfort during summer. Finally, process 1-9 is cooling with dehumidification. As mentioned before in the dehumidification process, air is cooled below its dew point temperature to dehumidify the air. This is the most common method for removing water from air. Theoretically, cooling with dehumidification process is drawn on psychrometric chart as 1-9. However in practice, process 1-9’ occurs 4. EXPERIMENTAL RIG Experimental set-up can be seen in Figure on the first page. Specifications and instrumentation are given below. 8 THERMODYNAMICS LABORATORY 4.1. Specification: 3 Air Throughput 0.13 m /s (max.) Pre-heater Extended fin electric heating elements. 2 x 1.0 kW (nominally) at 220 V. Cooler Direct expansion, extended fin coil. Cooling rate approx. 2.0 kW. Re-heater Extended fin electric heating elements. 2 x 0.5 kW (nominally) at 220V. Fan Centrifugal (variable speed). Power input approx. 120 W, at 240 V 50 Hz. Boiler Electrically heated and working at atmospheric pressure. Fitted with water level gauge and float level controller. Heaters: 1 x 1.0 kW and 2 x 2.0 kW at 220 V (nominally). Refrigerator Hermetic unit with air cooled condenser. Refrigerant: R134a Tetrafluoroethane CF3CH2F Compressor speed: 2700 to 3000 rev/min. at 50Hz. according to load. 3300 to 3600 rev/min. at 60Hz. 3 Swept volume: 25.95 cm /rev. 4.2. Instrumentation: Air Flow Measurement Orifice plate with inclined tube manometer. Temperature Measurement 4 pairs Wet and Dry Bulb glass thermometers 300 mm long, selected to agree within 0.2 C of each other at normal operating conditions. Refrigerant Circuit 3 x 300mm Glass thermometers. 4.3. Useful data: * The fan power input is approximately 72 W at normal operating conditions. * The specific heat of air Cp,air=1.005 kJ/(kg.K) * The specific heat of water Cp,water=4.18 kJ/(kg.K) * Heat loss from Boiler: 4.3 W/K. 9 THERMODYNAMICS LABORATORY z * Orifice calibration: ma 0.0504 kg / s . vD where, z= Orifice differential (mmH2O) vD= Specific volume of air at Station D (from psychrometric chart) * Compressor swept volume: 25.95cm3/rev. * 1 bar = 105 N/m2 = (or 100 kPa) =14.5 lbf/in2 * Absolute pressure = Gauge pressure + Atmospheric pressure * Standard atmospheric pressure = 101.3 kN/m2 (1013 mbar). * 1kW = 3412 Btu/h. 5. EXPERIMENTAL PROCEDURE Turn on the main power switch of the unit and adjust a fan speed around medium level. Start the refrigeration circuit turning on its switch. Increase the power inputs of Preheater, Re-heater and Boiler from minimum to maximum for the each test. Collect the data which are seen on the observation sheet while the system is running. 5.1. Specimen Calculations: Obtain the following air properties from the Psychrometric chart. A B C D Test Station 1 Enthalpy hA= hB= hC= hD= Moisture wA= wB= wC= wD= Enthalpy hA= hB= hC= hD= Moisture wA= wB= wC= wD= Enthalpy hA= hB= hC= hD= Moisture wA= wB= wC= wD= Enthalpy hA= hB= hC= hD= Moisture wA= wB= wC= wD= 2 3 4 From tables: hg at atmospheric pressure = 2676 kJ/kg hw at 20 ˚C (assumed) = 84kJ/kg he at 20 ˚C (assumed) = 84 kJ/kg 5.2. Calculation of air mass flow rate: Air mass flow rate, ma 0.0504 z D (1) 10 THERMODYNAMICS LABORATORY 5.3. Application of energy and mass balances between A and B: For the system enclosed by the chain line: By conservation of mass, mw ma (wB wA ) kg/s Heat transfer rate – Work transfer rate = Enthalpy transfer rate (2) Heat transfer rate – Work transfer rate QB QP (Pf ) (3) Enthalpy transfer rate ma (hB hA ) mw hw (4) Heat loss from the Boiler to the ambient 4.3W / K (TBoiledWater TAmbient ) TBoliedWater 100 ˚C (5) 5.4. Boiler theoretical evaporation rate: Assumptions, (i) Steam produced is saturated at atmospheric pressure and has a specific enthalpy of 2676 kJ/kg. (ii) The feed water is at 20 ˚C and has a specific enthalpy of 84 kJ/kg. Rate of evaporation Nominal Heater Input (6) - Calculated loss Steam Spec. Enth. - Feed Water Spec. Enth. This may be compared with the value obtained from the change of specific humidity between A and B. 5.5. Refrigerant properties: Obtain the following R134a properties from the R134a log P-h diagram. (Note: The throttling or expansion process 3 - 4 is assumed 11 to be adiabatic, h3 = h4) THERMODYNAMICS LABORATORY Test 1 kJ/kg h3=h4= -x4= kJ/kg h1= m3/kg v1= Test 2 h3=h4= x4= h1= v1= Test 3 h3=h4= x4= h1= v1= Test 4 h3=h4= x4= h1= v1= 5.6. Application of energy and mass balances between B and C: For the system enclosed by the chain line, Calculated rate of condensation from air stream: ma (w B wC ) This value should be close to the observed rate of condensed water. Heat transfer rate = Enthalpy change rate - Work transfer rate There is no work transfer rate between B and C, thus (7) QB C m a (hC hB ) me he mr (h1 h 4 ) 5.7. Application of energy and mass balances between C and D 12 THERMODYNAMICS LABORATORY Since there has been no increase or decrease in the moisture content between C and D, wC and wD should be equal. Qr 1kW , Q a ma (hD hC ) and Q aT maCPair (TD,dry TC,dry ) (8) 5.8. Volumetric efficiency of compressor: Volume flow rate at compressor intake, V1 mrv 1 Compressor swept volume, 25.95 106 x (9) 2900 3 [m / s ] 60 Volumetric efficiency of compressor (%), vol (10) V1 Swept .Volume (11) 6. PREPAIRING REPORT: A) Fill out the table calculating the results of equations for each test. Equation No 1 2 3 4 5 6 7 8 9 10 11 Test 1 Test 2 Test 3 Test 4 B) Draw an industrial air conditioning unit and explain parts of it. C) What is humidification and dehumidification. Explain why air is humidified or dehumidified? D) Give examples about air conditioning units which have no humidification control. 13
