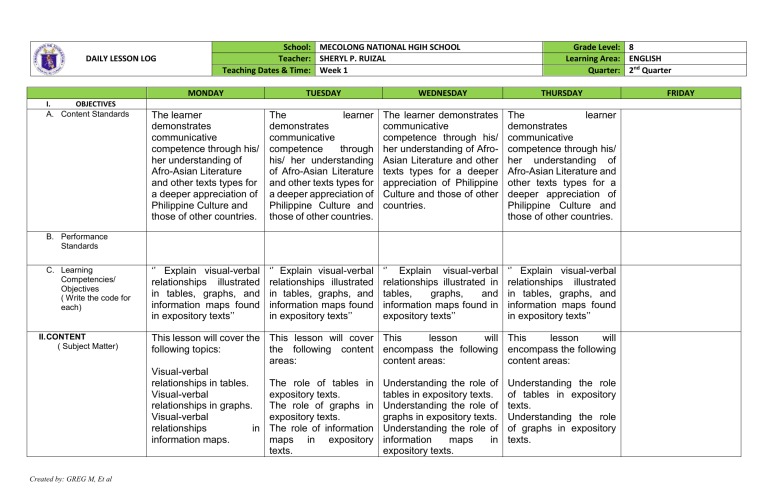
DAILY LESSON LOG I. OBJECTIVES A. Content Standards School: MECOLONG NATIONAL HGIH SCHOOL Teacher: SHERYL P. RUIZAL Teaching Dates & Time: Week 1 Grade Level: 8 Learning Area: ENGLISH Quarter: 2nd Quarter MONDAY TUESDAY WEDNESDAY THURSDAY The learner demonstrates communicative competence through his/ her understanding of Afro-Asian Literature and other texts types for a deeper appreciation of Philippine Culture and those of other countries. The learner demonstrates communicative competence through his/ her understanding of Afro-Asian Literature and other texts types for a deeper appreciation of Philippine Culture and those of other countries. The learner demonstrates communicative competence through his/ her understanding of AfroAsian Literature and other texts types for a deeper appreciation of Philippine Culture and those of other countries. The learner demonstrates communicative competence through his/ her understanding of Afro-Asian Literature and other texts types for a deeper appreciation of Philippine Culture and those of other countries. ‘’ Explain visual-verbal relationships illustrated in tables, graphs, and information maps found in expository texts’’ ‘’ Explain visual-verbal relationships illustrated in tables, graphs, and information maps found in expository texts’’ ‘’ Explain visual-verbal relationships illustrated in tables, graphs, and information maps found in expository texts’’ ‘’ Explain visual-verbal relationships illustrated in tables, graphs, and information maps found in expository texts’’ B. Performance Standards C. Learning Competencies/ Objectives ( Write the code for each) II. CONTENT ( Subject Matter) Created by: GREG M, Et al This lesson will cover the This lesson will cover following topics: the following content areas: Visual-verbal relationships in tables. The role of tables in Visual-verbal expository texts. relationships in graphs. The role of graphs in Visual-verbal expository texts. relationships in The role of information information maps. maps in expository texts. This lesson will This lesson will encompass the following encompass the following content areas: content areas: Understanding the role of tables in expository texts. Understanding the role of graphs in expository texts. Understanding the role of information maps in expository texts. Understanding the role of tables in expository texts. Understanding the role of graphs in expository texts. FRIDAY Analyzing and Analyzing and Analyzing and interpreting Understanding the role interpreting visual data in interpreting visual data visual data in expository of information maps in expository texts. in expository texts. texts. expository texts. Analyzing and interpreting visual data in expository texts. III. LEARNING RESOURCES A. References 1. Teacher’s Guide pages 2. Learner’s Material pages 3. Textbook pages 4. Additional Materials from Learning Resource LR portal B. Other Learning Resources IV. PROCEDURE A. Reviewing previous Lesson or presenting new lesson B. Establishing a purpose for the lesson Created by: GREG M, Et al (e.g., handouts, (e.g., handouts, online multimedia resources). presentations). (e.g., handouts, multimedia presentations). (e.g., handouts, multimedia presentations). (e.g., online articles, (e.g., websites, articles, real-world examples). sample expository texts). (e.g., online articles, sample expository texts). (e.g., online articles, sample expository texts). Begin the lesson by briefly reviewing the concepts related to expository texts and their purposes. Start by briefly revisiting the previous lesson, which may have covered topics related to expository texts or reading comprehension. Begin the lesson by briefly revisiting the previous lesson, focusing on any relevant concepts related to expository texts or reading comprehension. Begin the lesson by briefly revisiting the previous lesson, emphasizing any relevant concepts related to expository texts or reading comprehension. Explain to students that the focus of today's lesson is to understand how visual elements such as tables, graphs, and information maps contribute to the Explain to students that today's lesson will focus on understanding how visual elements like tables, graphs, and information maps contribute to the Explain to students that the primary objective of today's lesson is to gain a deeper understanding of how visual elements such as tables, graphs, and information maps contribute to the Explain to students that the primary aim of today's lesson is to gain a deeper understanding of how visual elements such as tables, graphs, and information maps contribute to the comprehension of expository texts. comprehension expository texts. C. Presenting examples/ instances of the new lesson. Show students a variety of sample expository texts that include tables, graphs, and information maps. Discuss these examples, emphasizing the role of visuals in conveying information. Show a variety of sample expository texts that incorporate tables, graphs, and information maps. Discuss these examples, emphasizing the role of visuals in conveying information effectively. Show a variety of sample expository texts that incorporate tables, graphs, and information maps. Engage in a discussion about these examples, emphasizing the role of visuals in conveying information effectively. D. Discussing new concepts and practicing new skills. #1 Break down the elements of a table. Discuss how to read and interpret the information within it. Allow students to practice by working on exercises related to tables. Begin with tables. Break down the elements of a table and discuss how to read and interpret the information within it. Allow students to practice with exercises related to tables. Begin with tables. Break down the elements of a table and discuss how to read and interpret the information within it. Allow students to practice their skills with exercises related to tables. E. Discussing new concepts and practicing new skills #2. Similarly, delve into the components of graphs (e.g., axes, data points, labels) and information maps (e.g., key, legends). Discuss how to extract information from these visuals and connect it to the accompanying text. Have students practice with graph and map exercises. Provide more complex expository texts with visuals for students to Move on to graphs. Explore the components of graphs (e.g., axes, data points, labels) and discuss how to extract information from these visuals and connect it to the accompanying text. Have students practice with graph-related exercises. Proceed to graphs. Explore the components of graphs (e.g., axes, data points, labels) and discuss how to extract information from these visuals and connect it to the accompanying text. Have students practice with graph-related exercises. Provide more complex expository texts with visuals for students to Provide more complex expository texts with visuals for students to F. Developing Mastery (Lead to Formative Assessment 3) Created by: GREG M, Et al of comprehension of expository texts. comprehension of expository texts. Show a variety of sample expository texts that incorporate tables, graphs, and information maps. Engage in a discussion about these examples, highlighting the role of visuals in conveying information effectively. Start with tables. Break down the elements of a table and discuss how to read and interpret the information within it. Allow students to practice their skills with exercises related to tables. Proceed to graphs. Explore the components of graphs (e.g., axes, data points, labels) and discuss how to extract information from these visuals and connect it to the accompanying text. Have students practice with graph-related exercises. Provide more complex expository texts with visuals for students to analyze. Encourage group discussions and peer evaluations to ensure mastery. analyze. Encourage group discussions and peer evaluations to ensure mastery. analyze. Encourage group discussions and peer evaluations to ensure mastery. analyze. Encourage group discussions and peer evaluations to ensure mastery. G. Finding practical application of concepts and skills in daily living Show real-world examples where understanding visualverbal relationships is crucial (e.g., scientific research reports, news articles). Discuss the practical implications of being able to interpret such visuals accurately. Show real-world examples where understanding visualverbal relationships is crucial (e.g., scientific research reports, news articles). Discuss the practical implications of being able to interpret such visuals accurately. Showcase real-world examples where understanding visualverbal relationships is crucial (e.g., scientific research reports, news articles). Discuss the practical implications of being able to interpret such visuals accurately. Showcase real-world examples where understanding visualverbal relationships is crucial (e.g., scientific research reports, news articles). Discuss the practical implications of being able to interpret such visuals accurately. H. Making Generalizations and Abstraction about the Lesson. Lead a class discussion where students generalize their learning by identifying common patterns in how visual elements are used in expository texts to enhance understanding. Lead a class discussion where students generalize their learning by identifying common patterns in how visual elements are used in expository texts to enhance understanding. Lead a class discussion where students generalize their learning by identifying common patterns in how visual elements are used in expository texts to enhance understanding. Lead a class discussion where students generalize their learning by identifying common patterns in how visual elements are used in expository texts to enhance understanding. I. 1. What is the purpose of including tables and graphs in expository texts, and how do they enhance the reader's understanding of the content? 1. Imagine you are reading a scientific research paper. Analyze a graph presented in the paper and explain how it supports or reinforces the main points made in the text. Evaluating Learning 2. Select a specific table or graph from a provided expository text 2. and describe how the text Created by: GREG M, Et al Choose a scientific research paper that includes multiple visuals (tables, graphs, or maps). Explain how these visuals collectively contribute to the reader's understanding of the research findings and concepts presented in 2. Describe a scenario the text. In an expository where a table or graph in discussing an expository text might be 1. Compare and contrast the visual-verbal relationship in a table with that in a bar chart. How does the choice of visual representation impact the reader's comprehension of the information? visual elements (e.g., economic trends, there axes, legends, labels) is a line graph showing complement the changes in accompanying textual unemployment rates information. over the past decade. Describe the key trends depicted in the graph 3. Explain the and how they relate to difference between a the written explanation. table and a graph in terms of their presentation of 3. Provide an information. When is it example of an more appropriate to use information map used in one over the other in an an expository text. expository text? Explain how the map's visual elements, such as color coding or icons, help convey complex information more ANSWER KEYS The purpose of including effectively than text tables and graphs in alone. expository texts is to visually represent 4. Discuss the complex data, enhancing potential challenges reader understanding by presenting information readers may face when interpreting complex concisely and visually. tables and graphs in Provide a detailed expository texts. How analysis of the chosen can authors address visual, highlighting these challenges to labels, scales, data ensure clarity and points, and their understanding? alignment with the text's content. ANSWER KEYS Created by: GREG M, Et al misleading or misinterpreted. How can readers critically evaluate the accuracy and reliability of such visuals? 3. Choose a realworld example of an expository text, such as a news article or a scientific report, and identify how visual elements (tables, graphs, or information maps) are strategically used to communicate complex data or concepts. Imagine you are teaching a class on data interpretation. Create a hypothetical table with incomplete or misleading labels, and then ask students to explain the challenges in interpreting the data accurately. How can these challenges be addressed? Provide an example of a complex infographic used in an expository text, such as a magazine article or an educational brochure. Describe how the infographic effectively conveys information and engages ANSWER KEYS Tables provide precise the reader in the text's values, while bar charts content. show relative differences more effectively. The In a history textbook, choice depends on the there is a timeline nature of the data and graphic that shows key historical events. Explain communication goals. how the timeline enhances the reader's Misleading visuals can occur when scales are comprehension of the narrative deceptive or important historical in the data is omitted. Critical presented accompanying text. evaluation, source checking, and understanding data Discuss the concept of visualization presentation techniques data techniques and their role are essential. in conveying complex Tables are suitable for presenting precise values, while graphs visually illustrate trends and relationships. Analyze the specific graph from the research paper, explaining how it supports the paper's main points by identifying key trends and data correlations. Describe trends in the unemployment rate graph and relate them to the written explanation in terms of economic events. Information maps use visual elements like color coding or icons to organize and present complex data more effectively than text alone. Readers may face challenges in interpreting tables and graphs, such as misinterpreting scales or missing key data points. Authors can address these challenges with clear labels and explanations. Created by: GREG M, Et al Choose a real-world example and explain how visual elements enhance the communication of complex data or concepts, providing specific examples from the text to illustrate your points. information. Provide examples of different types of data visualizations and explain when each is most appropriate in an expository context. Answer keys The visuals in the scientific research paper collectively contribute to the reader's understanding by visually representing data, relationships, and trends mentioned in the text. They provide a visual summary of the research findings and support the text's explanations. The hypothetical table with incomplete or misleading labels poses challenges for accurate data interpretation. Students should identify issues such as missing units, unclear column headers, or improperly scaled values. Addressing these challenges involves providing clear labels, units, and context. The complex infographic effectively conveys information by using visual elements such as icons, charts, and labels to organize and present data in a visually engaging way. It simplifies complex concepts and enhances reader engagement. The timeline graphic in the history textbook enhances comprehension by visually placing historical events in chronological order. It allows readers to see the sequence of events and their relationship to the historical narrative in the text. Data visualization techniques help convey complex information through visuals like charts, graphs, and maps. For example, a line chart can show trends over time, a bar chart can compare categories, and a map can display geographic distribution. The choice depends on the data's Created by: GREG M, Et al nature and the communication goals. J. Additional Activities for Application or Remediation V. REMARKS VI. REFLECTION A. No. of learners earned 80%in the evaluation. B. No. of learners who required additional activities for remediation who scored below 80% C. Did the remedial lesson work? No. of learners who have caught up with the lesson. D. No. of learner who continue to require remediation E. Which of my teaching strategies worked well? Why did these work? F. What difficulties did I encounter which my principal or supervisor can help me solve? G. What innovation or localized materials did I used/discover which I wish to share with other teachers? Created by: GREG M, Et al For students who need further support, provide additional exercises or offer one-on-one assistance. For advanced learners, assign more challenging texts with visuals. Offer additional exercises or one-onone support for students who need further assistance. For advanced learners, assign more challenging texts with visuals. Offer additional exercises or one-on-one support for students who need further assistance. For advanced learners, assign more challenging texts with visuals. Offer additional exercises or one-on-one support for students who need further assistance. For advanced learners, assign more challenging texts with visuals. Prepared by: Checked by: Teacher III School Principal I Created by: GREG M, Et al


