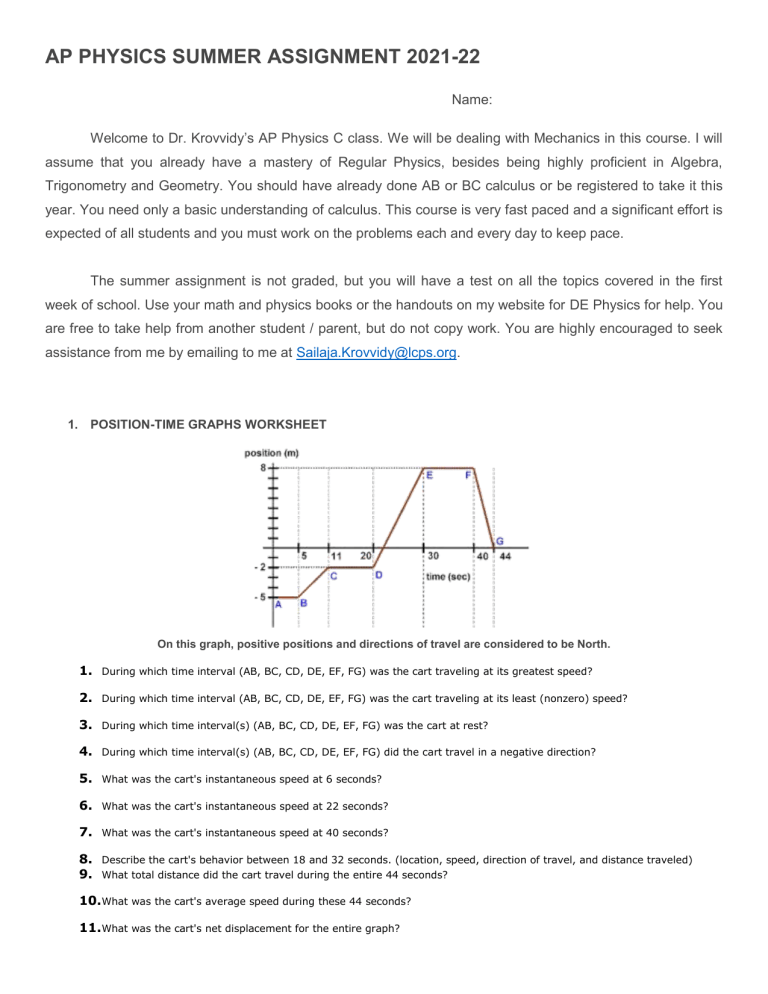
AP PHYSICS SUMMER ASSIGNMENT 2021-22 Name: Welcome to Dr. Krovvidy’s AP Physics C class. We will be dealing with Mechanics in this course. I will assume that you already have a mastery of Regular Physics, besides being highly proficient in Algebra, Trigonometry and Geometry. You should have already done AB or BC calculus or be registered to take it this year. You need only a basic understanding of calculus. This course is very fast paced and a significant effort is expected of all students and you must work on the problems each and every day to keep pace. The summer assignment is not graded, but you will have a test on all the topics covered in the first week of school. Use your math and physics books or the handouts on my website for DE Physics for help. You are free to take help from another student / parent, but do not copy work. You are highly encouraged to seek assistance from me by emailing to me at Sailaja.Krovvidy@lcps.org. 1. POSITION-TIME GRAPHS WORKSHEET On this graph, positive positions and directions of travel are considered to be North. 1. During which time interval (AB, BC, CD, DE, EF, FG) was the cart traveling at its greatest speed? 2. During which time interval (AB, BC, CD, DE, EF, FG) was the cart traveling at its least (nonzero) speed? 3. During which time interval(s) (AB, BC, CD, DE, EF, FG) was the cart at rest? 4. During which time interval(s) (AB, BC, CD, DE, EF, FG) did the cart travel in a negative direction? 5. What was the cart's instantaneous speed at 6 seconds? 6. What was the cart's instantaneous speed at 22 seconds? 7. What was the cart's instantaneous speed at 40 seconds? 8. Describe the cart's behavior between 18 and 32 seconds. (location, speed, direction of travel, and distance traveled) 9. What total distance did the cart travel during the entire 44 seconds? 10.What was the cart's average speed during these 44 seconds? 11.What was the cart's net displacement for the entire graph? 12.What was the cart's average velocity during these 44 seconds? Using the position – time graph information from above, construct a velocity – time graph for the cart. 2. Give the answer in scientific notation: a. (7.2 x 1021) x (3.3 x 10 -19 b. (6.3 x 10¹¹) / (2.3 x 10¹³) = (8.0 x 1016) x (1.3 x 10 -18 d. (1021)1/3 = c. ) = ) / (4.9 x 10⁻²¹) = 3. Give the answer with proper units a. = 2 l = g b. K= 1 mv2 = 2 c. e= 512 J 223 J = 512 J d. 1.35 sin(300) = 1.7 sin() e. E = h= (l = 4.0 x 10⁻³ m and g = 9.8 m/sec2) (m = 9.1 x 10⁻³¹ kg, v = 3 x 10⁴ m/sec) =? (h = 6.63 x 10⁻³⁴ J.sec, = 7.3 x 10¹⁸ Hz) 4. Solve for the given variable, by expressing it in terms of all the other variables For example x2.y = n a. x2 + y2 = r2 b. F c. = n y x = _________________ Gm1m 2 d2 k m then x = d = ___________________ and d. F = mv2 / r = 2 express in terms of k, m and v = _________________________ e. aC = v2 / r and v = 2r / express aC in terms of , r, and 5. Derive new equations from the two given equations. Show all work. a. From the first two equations of kinematics, vf = vi + a.t and d = (vi + vf).t /2 derive the other two equations of kinematics by eliminating vf to get the third equation and eliminating t to obtain the fourth equation. 6. Vectors: a. Draw to scale the addition of vectors A = 5 cm, east; B = 2 cm, north and C = 7 cm, 450 south of west. Find the magnitude and direction of the resultant. b. If r = (-4, 9) and s = (6, 8), then find q = 3r + 5s c. If A is a fourth quadrant vector of magnitude 89.0 newton and makes an angle = 240 with the Y-axis, what are the x and y components of A equal to? d. What is the angle between the vectors m = <3, 4,-5> and n = <-7,-2, 0>? e. If A = f. and B = then draw 2A – B If AX = - 90 m/sec and AY = 120 m/sec, what is the magnitude and direction of the resultant? Which quadrant does it belong to? 7. Graphing concepts: a. If v = vo - 9.8.t is plotted on a v vs t plot, then slope = __________ and y-intercept is __________ b. What is the shape of a c. y = ax2 + bx + c graph? Plot the graphs below a. velocity – time graph for an object moving with a constant negative velocity b. velocity – time graph for the entire trip of an object that is thrown from the ground reaches maximum height and falls back to the ground c. distance - time graph for the scenario described in b. d. distance – time graph for an accelerating object with constant positive acceleration a b c d plot y = a.x-1 plot y 1 x plot y2 = 4ax plot y x


