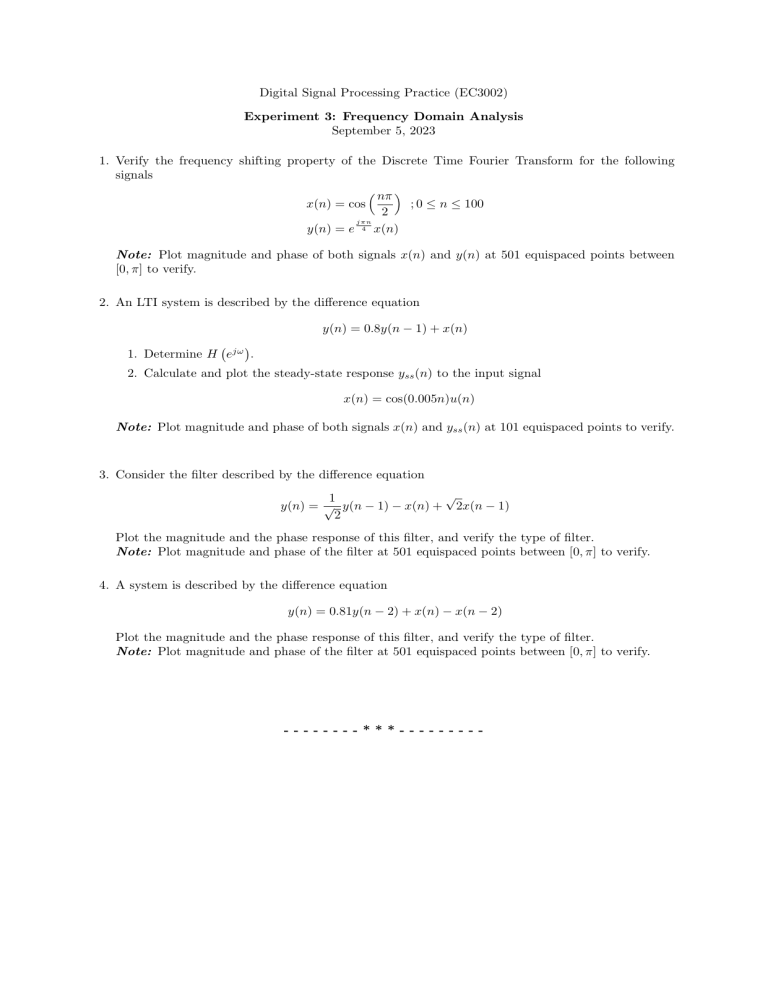
Digital Signal Processing Practice (EC3002) Experiment 3: Frequency Domain Analysis September 5, 2023 1. Verify the frequency shifting property of the Discrete Time Fourier Transform for the following signals nπ ; 0 ≤ n ≤ 100 x(n) = cos 2 jπn y(n) = e 4 x(n) Note: Plot magnitude and phase of both signals x(n) and y(n) at 501 equispaced points between [0, π] to verify. 2. An LTI system is described by the difference equation y(n) = 0.8y(n − 1) + x(n) 1. Determine H e jω . 2. Calculate and plot the steady-state response yss (n) to the input signal x(n) = cos(0.005n)u(n) Note: Plot magnitude and phase of both signals x(n) and yss (n) at 101 equispaced points to verify. 3. Consider the filter described by the difference equation √ 1 y(n) = √ y(n − 1) − x(n) + 2x(n − 1) 2 Plot the magnitude and the phase response of this filter, and verify the type of filter. Note: Plot magnitude and phase of the filter at 501 equispaced points between [0, π] to verify. 4. A system is described by the difference equation y(n) = 0.81y(n − 2) + x(n) − x(n − 2) Plot the magnitude and the phase response of this filter, and verify the type of filter. Note: Plot magnitude and phase of the filter at 501 equispaced points between [0, π] to verify. --------***---------


