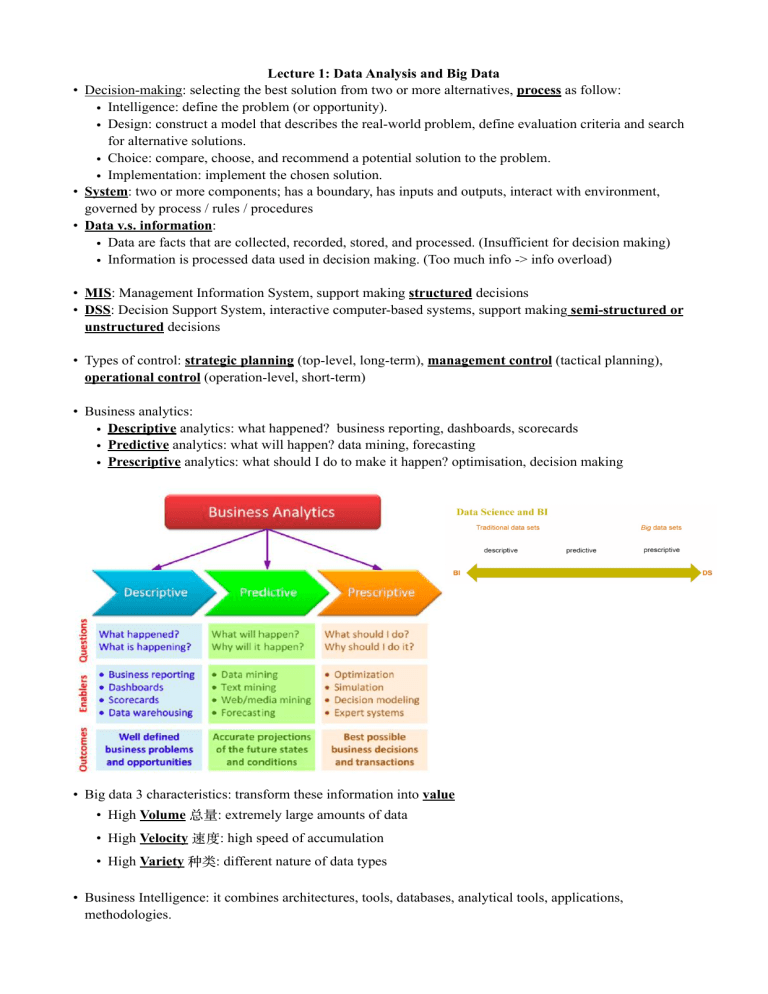
Lecture 1: Data Analysis and Big Data • Decision-making: selecting the best solution from two or more alternatives, process as follow: • Intelligence: define the problem (or opportunity). • Design: construct a model that describes the real-world problem, define evaluation criteria and search for alternative solutions. • Choice: compare, choose, and recommend a potential solution to the problem. • Implementation: implement the chosen solution. • System: two or more components; has a boundary, has inputs and outputs, interact with environment, governed by process / rules / procedures • Data v.s. information: • Data are facts that are collected, recorded, stored, and processed. (Insufficient for decision making) • Information is processed data used in decision making. (Too much info -> info overload) • MIS: Management Information System, support making structured decisions • DSS: Decision Support System, interactive computer-based systems, support making semi-structured or unstructured decisions • Types of control: strategic planning (top-level, long-term), management control (tactical planning), operational control (operation-level, short-term) • Business analytics: • Descriptive analytics: what happened? business reporting, dashboards, scorecards • Predictive analytics: what will happen? data mining, forecasting • Prescriptive analytics: what should I do to make it happen? optimisation, decision making • Big data 3 characteristics: transform these information into value • High Volume 总量: extremely large amounts of data • High Velocity 速度: high speed of accumulation • High Variety 种类: different nature of data types • Business Intelligence: it combines architectures, tools, databases, analytical tools, applications, methodologies. • BI is a content-free expression, it means different things to different meaning, major objective is to enable access to data and business managers to analyse it. • BI Architecture: • A data warehouse with its source data • Business analytics (collection of tools for manipulating, mining, analysing data) • Business performance management (BPM) capabilities for monitoring and analysing performance • A user interface (e.g. dashboard) • Key functions of BI: • Report delivery and alerting • Enterprise reporting • Cube analysis • Ad hoc queries • Statistics and data mining • • • • • Lecture 2: Data Warehousing Databases: store facts about real world entities from daily business operations (e.g. customers). Data warehouse: used for analysing data to support decision making. Basic characteristics of data warehouse: relational, time-variant, non-volatile Advantages of database systems: • Data integration • Data sharing • Data independence Program runs the database system: DBMS (Database management system) • Data mart: small data warehouse • Dependent data mart: a subset that is created directly from a data warehouse. • Independent data mart: a small data warehouse designed for a strategic business unit • Common data warehouse architectures: • Independent data mart • Dimensional data mart: data linked by conformed dimensions • Hub-and-spoke: firstly stored in the normalised relational warehouse, and then dependent marts can be created from it for different purposes • Centralised data warehouse: directly access to the central warehouse when need it • Federated architecture: existing data warehouse or mart, take some physical / local integration • Extraction, Transformation, and Load (ETL) 1. Extraction: selecting and reading the data from databases 2. Transformation: converted the extracted data into the desired form for analysis - Cleanse: detect errors and clean them 3. Loading: putting data into databases • OLTP: online transaction processing, used for transaction processing systems such as ERP for capturing and storing data, to process routine operational business tasks. • OLAP: online analytical processing, converting data into information for decision making, focus on analysing data, such as: • Dice: look into some value from different dimensions, and analyse them separately • Slice: focus on single value from one of the dimensions • Drill down / up: from summarised data to details • Roll up: compute data relationships • Pivot: swap dimensions (e.g. swap attributes in horizontal and vertical) • Data lakes: we store any kind of data in it, regardless whether it’s useful or not, we can later decide whether we can use the data. Lecture 3: Data Concepts and Data Modelling Data concepts: • Relational databases: the database tables are related or connected to each other through common fields that appear in two or more tables. • Metadata: is data that describes other data • Syntactic metadata: describing the syntax of data • Structural metadata: structure of data • Semantic metadata: describing the meaning of data in a specific domain • Data hierarchy • Database: collection of related files • Entity set (table/file): collection of related records with a unique name • Tuple (row/record): collection of data elements about a single entity • Attribute (column/field): describe the characteristics of an entity type (e.g. customer name) • Data fields & records: fields shown in columns, records shown in rows, a data element is an entry in the field (column) for a specific entity (row) • Database tables: databases store data in multiple tables that are related to each other via primary and foreign key relationships • Attributes • Primary key: a unique identifier for each record in a database table • Foreign key: an attribute in one table that is an identifier in another table • Database components • Database tables: store data • Database forms: on-screen forms used for database input • Database queries : used for database searches and inquires • Database reports: used for database output either on-screen or printout Data modelling: • Two approaches to database design • Normalisation (bottom-up) • Semantic data modelling (top-down): • Knowledge about business process and information needs is used to create a diagram (Entity Relationship Diagram). This describes the relationships of the data recorded . • Entity relationship modelling • Entities: represent real-world things or objects. e.g. employees, customers, etc. • Attributes: characteristics of entities. e.g. customer name • Relationships: are associations between entities • Cardinality expresses the number of entity occurrences associated with one occurrence of a related entity. • Types of relationships 1:1 C:C 1:N 1:NC 1:C M:N M:NC MC:NC Lecture 4: Data Retrieval ERD Transformation: • Requirements for relational databases: • Each column must be single valued • Primary key cannot be null • Foreign key must contain data that are same as the primary key in its table • All non-key attributes describe a characteristic of the entity identified by the primary key SQL: • SQL Commands: • DDL (data definition language): CREATE; ALTER; DROP • DML (data manipulation language): INSERT; UPDATE; DELETE • DQL (data query language, part of DML): SELECT; WHERE • DCL (data control language) and TCL (transaction control language) • Used in various processes related to database maintenance and administrative use. • SQL Data Type: Lecture 5: Data Mining • Predictions: based on events happened in the past, predict future occurrence • Association: find the commonly co-occurring groupings of things • Clusters 分组: identify natural groupings of things based on their known characteristics, e.g. assigning customers to different segments based on their past purchase behaviours. • Accuracy of Classification model: • Assessment criteria for classification: • Predictive accuracy: hit rate • Speed: model building, predicting • Robustness: the ability to overcome the noisy data to make accurate predictions. • Scalability • Interpretability: transparency, explanatory power • Decision tree criteria: • Splitting criteria: which variables should we use? Which value ranges? • Stopping criteria: when should we stop building the tree? How many levels do we want to follow? • Pruning: the result might be a very complex decision tree, how can we condense the tree? • Clustering • Used to identify natural groupings of customers Step 1: determine value of k Step 2: randomly generate k random points as initial cluster centres Step 3: assign each point to the nearest cluster centre Step 4: re-compute the new cluster centres • Association • Find relationships between variables • This is no output variable Lecture 6: Text Mining • (Qualitative) • information extraction, topic tracking, summarisation, categorisation, clustering, concept linking, question answering • accounting, finance, law, medicine, marketing, academia • Text mining process: Step 1: establish the corpus, collect and organise the domain unstructured data Step 2: create the term-document-matrix (TDM), introduce structure to the corpus Step 3: extract knowledge, discover patterns test exam (F) • Sentiment analysis • Used to answer the question: what do people feel about a certain topic? • Applications: customer satisfaction, financial markets, politics, … • Process Step 1: sentiment detection, also called ‘detection of objectivity’, O-S Polarity Fact [=objectivity] v.s. Opinion [=subjectivity] Step 2: N-P Polarity Classification N [=negative] v.s. P [=positive] Step 3: target identification, to accurately identify the target of the expressed sentiment (e.g. a person) Step 4: collection and aggregation, once the sentiments of all text data points in the document are identified and calculated, they are to be aggregated. Word -> Statement -> Paragraph -> Document Lecture 7: Process Mining • The aim of process mining is the extraction of information about business processes • They are techniques, tools, and methods to discover, monitor, and improve real processes, by extracting knowledge from events Summary: • Process variants: detected number of variants will be shown • Coverage of cases: the number of cases that are represented by the shown model • Fitness: unfitting model refers to false negative audit results, which means compliance violations are not detected. • Precision: imprecise model refers to false positive audit results, which means compliance violations are indicated, however they did not occur in reality.

