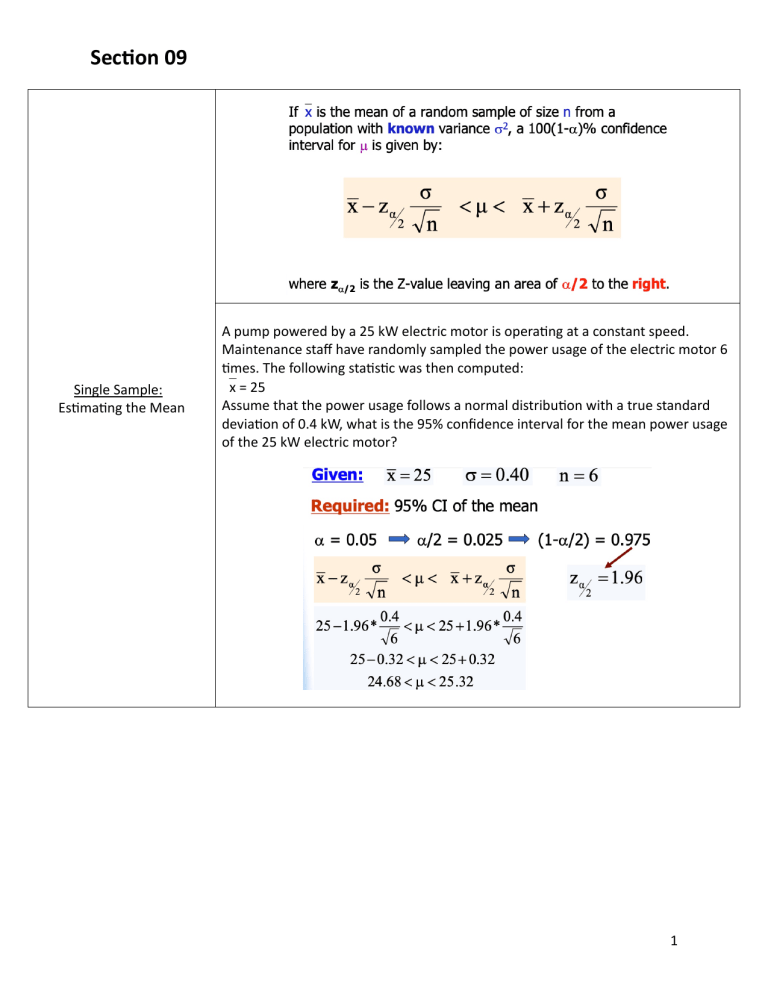
Sec$on 09 Single Sample: Es/ma/ng the Mean A pump powered by a 25 kW electric motor is opera/ng at a constant speed. Maintenance staff have randomly sampled the power usage of the electric motor 6 /mes. The following sta/s/c was then computed: `x = 25 Assume that the power usage follows a normal distribu/on with a true standard devia/on of 0.4 kW, what is the 95% confidence interval for the mean power usage of the 25 kW electric motor? 1 Single Sample: Es/ma/ng the Mean (Concept of Error) Case 1 For the data given in Example #1 and from the solu/on obtained in part 1: How large a sample is needed if we wish to be 95% confident that our sample mean will be within 0.20 kW of the true mean? 2 Single Sample: Es/ma/ng the Mean (Concept of Error) Case 2 A plas/c extrusion machine produces sheets with a nominal thickness of 7.5 mm. A sample of 11 measurements has produces a mean thickness of 7.8 mm with a standard devia/on of 0.8 mm. What is the 99% confidence interval for the mean sheet thickness? Assume a normal distribu/on. **Random Sample from a normal popula/on with unknown Variance.** 3 Single Sample: Es/ma/ng the Mean (Concept of Error) Case 3 **Random Sample of size n³30 from a normal popula/on with unknown Variance.** Suppose a PC manufacturer wants to evaluate the performance of its hard disk memory system. One measure of performance is the average /me between failures of the disk drive. To es/mate this value, a quality control engineer recorded the /me between failures from a random sample of 45 disk-drive failures. The following sample sta/s/cs were computed: `x = 1762 hours and S = 215 hours Es/mate the true mean /me between failures with a 90% confidence interval. 4 We want to es/mate at 95% CI the difference between the mean star/ng salaries for recent graduates with civil engineering and oil&gas engineering degrees in Alberta. The following informa/on is available (June 2006 © APEGGA): Two Sample: Es/ma/ng the Difference of the Means 1.A random sample of 46 star/ng salaries for AB oil&gas engineering graduates (Case 1) produced a sample mean of $54,788 with a normal popula/on standard devia/on of From Popula/ons with $5,120. Known variances but different 2.A random sample of 37 star/ng salaries for AB civil engineering graduates produced a sample mean of $61,442 with a normal popula/on standard devia/on of $3,600. 5 Two Sample: Es/ma/ng the Difference of the Means (Case 2) During the first week of May 2003, 25 of Palm M515 PDA were auc/oned off on eBay, 7 of which had the “buy-it-now” op/on. *“Buy-it-now” op/on: 235 225 225 240 250 250 210 *“Bidding only”: 250 249 255 200 199 240 228 255 232 246 210 178 246 240 245 225 246 225 Find the 95% CI for the difference of the means. Assume both popula/ons are normal with equal variances. From Normal Popula/ons with Unknown but equal Variances 6 Two Sample: Es/ma/ng the Difference of the Means (Case 3) From Normal Popula/ons with Unknown and unequal Variances A taxi company is trying to decide whether to purchase brand A or brand B /res for its fleet of taxis. To es/mate the difference in the two brands, an experiment is conducted using twelve of each brand. The /res are run un/l they wear out. The results are: Brand A: mean=36,300 km & Stdev = 5,000 km Brand B: mean=38,100 km & Stdev = 6,100 km Compute the 95% CI for assuming the popula/ons to be approximately normal. You may not assume that the variances are equal. 7 The following table provides data on the modulus of elas/city obtained 1 min amer loading in a certain configura/on. The values were also obtained 4 weeks amer loading for the same lumber specimens. Two Sample: Es/ma/ng the Difference of the Means for Paired Observa/ons (Case 4) What is the 95% CI for the difference in modulus of elas/city? 8 Single Sample: Es/ma/ng a Popula/on Propor/on In 2000, the Americans were asked: “Are you willing to pay much higher prices in order to protect the environment?” Of 1154 respondents, 518 were willing to do so. Find and interpret a 95% confidence interval for the popula/on propor/on of adult Americans willing to do so at the /me of the survey. 9 Single Sample: Es/ma/ng the Variance A quality control supervisor in a cannery knows that the exact amount each can contains will vary, since there are certain uncontrollable factors that affect the amount of fill. The mean fill per can is important, but equally important is the varia/on, S2, of the amount of fill. If S2 is large, some cans will contain too linle and others too much. To es/mate the varia/on of fill at the cannery, the supervisor randomly selects 10 cans and weights the content of each. The weights (in ounces) are: 7.96 7.90 7.98 8.01 7.97 7.96 8.03 8.02 8.04 8.02 Construct a 90% confidence interval for the true standard devia/on of the can weights. 10 Two Samples: Es/ma/ng the Ra/o of 2 Variances A firm has been experimen/ng with 2 different physical arrangements of its assembly line. It has been determined that both arrangements yield approximately the same average number of finished units per day. To obtain an arrangement that produces greater process control, you suggest that the arrangement with the smaller variance in the number of finished units produced per day be permanently adopted. 2 independent random samples yield the following data: Construct a 95% CI for . Based on the result, which of the 2 arrangements would you recommend? 11 12 13 14 15
