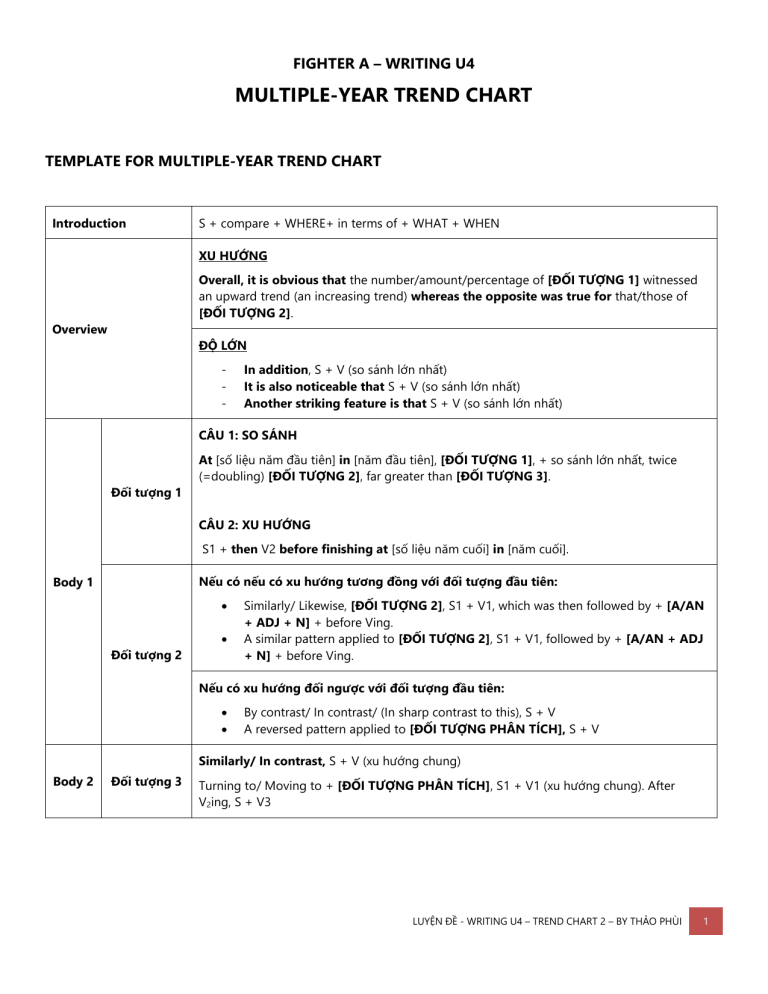
FIGHTER A – WRITING U4 MULTIPLE-YEAR TREND CHART TEMPLATE FOR MULTIPLE-YEAR TREND CHART Introduction S + compare + WHERE+ in terms of + WHAT + WHEN XU HƯỚNG Overall, it is obvious that the number/amount/percentage of [ĐỐI TƯỢNG 1] witnessed an upward trend (an increasing trend) whereas the opposite was true for that/those of [ĐỐI TƯỢNG 2]. Overview ĐỘ LỚN - In addition, S + V (so sánh lớn nhất) It is also noticeable that S + V (so sánh lớn nhất) Another striking feature is that S + V (so sánh lớn nhất) CÂU 1: SO SÁNH Đối tượng 1 At [số liệu năm đầu tiên] in [năm đầu tiên], [ĐỐI TƯỢNG 1], + so sánh lớn nhất, twice (=doubling) [ĐỐI TƯỢNG 2], far greater than [ĐỐI TƯỢNG 3]. CÂU 2: XU HƯỚNG S1 + then V2 before finishing at [số liệu năm cuối] in [năm cuối]. Nếu có nếu có xu hướng tương đồng với đối tượng đầu tiên: Body 1 • Đối tượng 2 • Similarly/ Likewise, [ĐỐI TƯỢNG 2], S1 + V1, which was then followed by + [A/AN + ADJ + N] + before Ving. A similar pattern applied to [ĐỐI TƯỢNG 2], S1 + V1, followed by + [A/AN + ADJ + N] + before Ving. Nếu có xu hướng đối ngược với đối tượng đầu tiên: • • By contrast/ In contrast/ (In sharp contrast to this), S + V A reversed pattern applied to [ĐỐI TƯỢNG PHÂN TÍCH], S + V Similarly/ In contrast, S + V (xu hướng chung) Body 2 Đối tượng 3 Turning to/ Moving to + [ĐỐI TƯỢNG PHÂN TÍCH], S1 + V1 (xu hướng chung). After V2ing, S + V3 LUYỆN ĐỀ - WRITING U4 – TREND CHART 2 – BY THẢO PHÙI 1 TABLE 1 (04/01/2020) The table gives information about five types of vehicles registered in Australia in 2010, 2012 and 2014. % change from 2010 to 2014 2010 2012 2014 11,800,000 12,700,000 13,000,000 +10.2% 2,300,000 2,600,000 2,700,000 +17.4% Motorcycles 540,000 680,000 709,000 +30.8% Heavy trucks 384,000 390,000 416,000 +8.3% Light trucks 106,000 124,000 131,000 +23.5% Passenger vehicles Commercial vehicles The table compares the numbers of five different kinds of vehicles that were registered in Australia in three different years, 2010, 2012 and 2014. Overall, the numbers of all five types of vehicles registered (1) _________________ (một xu hướng tăng) over the period shown. Another striking feature is that the figure relating to registered passenger vehicles was (2) ____________ (highest/ the highest) in all three years, however, motorcycles saw the most (3) _____________ (đáng kể) growth. DETAIL 1 (PHÂN NHÓM LỚN) In the initial year, 11.8 million passenger vehicles were registered, while the figure (4) _______________ commercial ones was significantly lower, at only 2.3 million. Over the following four years, the number of passenger vehicles rose (5) ________ (thêm) 10.2% to 13 million, whereas there were four million more commercial vehicles registered, a rise (6) _________ (thêm) 17.4%. DETAIL 2 (PHÂN NHÓM NHỎ) (7) _____________________ the remaining types of vehicles, the greatest increase was (8) ______________ (ghi nhận) for motorcycles, which grew from 540,000 registered in 2010 to 709,000 in 2014, an increase of 30.8%. During the same period, the numbers of heavy trucks and light trucks registered also rose, (9) ___________ (thêm) 8.3% and 23.5%, to 416,000 and 131,000 respectively. ANSWER KEY 1. 2. 3. 4. 5. 6. 7. an upward trend/ an increasing trend highest significant/ substantial/ marked for by of regarding/ as for/ turning to/ moving to 8. 9. recorded by LUYỆN ĐỀ - WRITING U4 – TREND CHART 2 – BY THẢO PHÙI 2 LINE CHART 1 The graph shows the value in US dollars (in millions of dollars) of investment in funds of four categories from 1988 to 2014. The line graph provided compares and show changes in the amount of investment which was allocated to four different sectors over the course of 36 years starting from 1988. Overall, it is evident that all the four categories experienced an upward trend in funds received from investment with the most remarkable rise being seen in Gold, the item which then finished as the most heavily invested asset by the end of the period. DETAIL 1 (GOLD – FINE ART) In the initial year, Gold attracted the highest amount of investment, numbering 100 million dollars, which was significantly higher than = (which far exceeded) the amount (which was) allotted to the other categories. After a period of fluctuation from 1988 to 2006, the investment for this item then soaring to 450 million dollars in 2012 prior to dropping remarkably to approximately 375 million dollars. Fine Art, similarly, also recorded a dramatic rise in the given period (câu chuyển). Starting at 75 million dollars, funds allotted to this asset fluctuated in the following 18 years before registering a marked growth to roughly 340 million dollars in 2014, surpassing Company Shares to become the second most invested item. ĐỐI TƯỢNG 1 • • S1 + so sánh nhất, numbering + số liệu, which was significantly higher than = (which far exceeded) + S2 After + Ving1 (gia đoạn đầu), S + then V2 (giai đoạn 2) + prior to V3 (giai đoạn cuối) ĐỐI TƯỢNG 2 • • ĐỐI TƯỢNG 2, similarly, also recorded a dramatic/minimal rise/growth/ increase in the given period Starting at + số liệu năm đầu, S + V1 before V2ing In the same period, Company and Real Estate recorded a similar gradual increase over time with a more pronounced rise being found in the funds for Company Shares. Beginning with a similarly insignificant amount of about 50 million dollars in the starting year, these two assets draw/ attracted substantially more investment interest, amounting to around 250 million dollars for the former (=Company) and 145 million dollars for the latter (=Real Estate). PHÂN NHÓM 2 (Phân tích chung vì số liệu bé và pattern giống nhau) In the same period, S +V (nhận định chung) • Beginning with a similar figure/rate/ number/ amount of, S + V (mô tả sự thay đổi) LUYỆN ĐỀ - WRITING U4 – TREND CHART 2 – BY THẢO PHÙI 3 LINE CHART 2 (11/07/2020) The line graph shows the percentage of renewable energy generation over total energy produced in 6 countries from 2010 to 2013. The provided line graph compares changes in the proportion of green energy (1) ______________ (generate) by 6 different countries over the course of 4 years starting from 2010. Overall, carbon-free energy gained traction (trở nên phổ biến) in most of these countries (2) _______________ (ngoại trừ) India whose percentage remained stable throughout the surveyed period. It is also noticeable that Germany was the largest powerhouse (nhà máy năng lượng) whereas the opposite was true for China. DETAIL 1: ĐIỂM ĐẦU (SO SÁNH) In the initial year, China (3) __________________ (đứng đầu) in terms of sustainable energy production, (4) _____________ (chiếm) approximately 20% of total energy use. This rate was slightly higher than the percentage of renewable energy use in Germany and India, at roughly 17% each. The use of such power was consistently lower in Spain, France and The USA, ranging from 10% to 12%. DETAIL 2: ĐIỂM CUỐI (MÔ TẢ SỰ THAY ĐỔI) During the following years, clean energy gained in popularity (trở nên phổ biến) in Germany, with a marked increase (5) ____________ 25%, surpassing (vượt mặt) China to become the (6) ___________ (largest/ highest) producer of this source of energy. (7) _____________________ (tương tự), the percentage of the latter also saw a growth to just over 20%, after (8) ______________ (chứng kiến) a drop to 17% in 2011 and a recover to 20% in 2012. Spain, France and The United States also recorded a similar pattern but with a more modest rise (9) ___________ (thêm) 2% to 3% for each country while the proportion of green energy in India stayed unchanged at 17%. ANSWER KEY 1. 2. 3. 4. 5. generated (which was generated) except ranked first/ took the leading position accounting for (which accounted for) to 6. 7. 8. 9. largest similarly/ likewise experiencing/ registering/ seeing of LUYỆN ĐỀ - WRITING U4 – TREND CHART 2 – BY THẢO PHÙI 4 LINE CHART 3 The graph below shows relative price changes for fresh fruits and vegetables, sugars and sweets, and carbonated drinks between 1978 and 2009. similar increased significantly to finished changes sharply minor The line graph provides information about (1) _________________ (sự thay đổi) in price in the USA of three different food product groups from 1979 to 2009, and the overall trend in the consumer price index over this 30-year period. Overall, it is clear that prices (2) __________________ (tăng) for the three food product groups, despite fluctuations. In addition, only the increase in the prices for fresh fruits and vegetables was (3) ___________________ (rất nhiều) higher than the rise in the general consumer price index. All the lines on the graph had the same starting figure in 1979. Over the period, the consumer price index rose steadily from around 60 in 1979 (4) _______________ (lên đến) over 200 in 2009. A (5) __________________ (tương tự) pattern was seen in the figures for prices for sugar and sweets and carbonated drinks. Although their prices also rose, they were consistently lower than the consumer price index average after 1987. After many (6) __________________ (nhỏ) fluctuations, the indexes for sugar and sweets was 200 on the graph in 2009, higher than the final figure for carbonated drinks at 150. Prices rose (7) ________________(đáng kể) for fresh fruits and vegetables, particularly after 1989. From the same figure of about 60 at the start of the period, the prices (8) _____________ (kết thúc) at roughly 330 on the index in 2009. ANSWER KEY 1. changes 2. increased 3. significantly 4. to 5. similar 6. minor 7. sharply 8. finished LUYỆN ĐỀ - WRITING U4 – TREND CHART 2 – BY THẢO PHÙI 5 LINE CHART 4 (25/04/2020) The chart below shows the percentage of cinema attendance by age group in Great Britain from 1984 to 2000 The line graph compares the proportion of people in four different age groups who went to the cinema in Great Britain over the course of 16 years starting from 1984. Overall, the percentages for cinema attendances, despite some (1) __________________ (sự dao động), rose throughout this period among all the age groups. In percentage terms, attendance at the cinema was (2) _______________ (cao nhất) among the 15-24 age group. DETAIL 1: ĐIỂM ĐẦU (SO SÁNH) In the initial year (= In 1984), about 17% of those aged 15-24 went to the cinema, (3) ________________ (far exceed) the percentage of cinema goers from 7 to 14 years old, at 10% and (4) almost _______________ (gấp 4 lần) cinema attendance among young adults in the 25-35 age group, with only 4% attendance. Only a tiny portion of people aged over 35 went to the cinema for a movie in the year, with a mere percentage of 1%. DETAIL 2: ĐIỂM CUỐI (MÔ TẢ SỰ THAY ĐỔI) During the following years, the figures for all the four age groups (5) ___________________ (chứng kiến) a fluctuating increasing trend. Having reached a peak of 59% in 1999, attendance among the 15-24 years old dropped back (6) ________________ (xuống còn) 55% in 2000. In contrast, the percentage of cinema attendees over 35 years old remained _____________ (7) (lowest/ the lowest) among the age groups despite a steady growth to 14% in 2000. In the same year, the figures for the 7-14 and 25-35 year olds increased to the same level, at 32%. ANSWER KEY 1. 2. 3. 4. fluctuations highest far exceeding = which far exceeded 4 times as high as = four-fold higher than 6 BAR CHART 1 The graph shows estimated oil production capacity for several Gulf countries between 1990 and 2010. The bar chart compares estimated oil production capacity in six Gulf countries over the course of 20 years staring from 1990. Overall, it is obvious that the amount of oil production capacity of most countries witnessed an upward trend except that of Qatar. In addition, Saudi Arabia was the biggest oil producer among the examined countries. DETAIL 1: SAUDI ARABIA & QATAR (1) ________________________ (bắt đầu từ) just over 8 million barrels in 1990, the estimation for oil production in Saudi Arabia increased slightly (2) _____________ (lên đến) about 9 million barrels per day in 2000. It (3) ____________ (sau đó) registered a dramatic growth to more than 12 million of barrels in 2005 before (4) ____________________ (đạt đỉnh) approximately 15 million barrels in 2010. (5) _________________ (ngược lại), Qatar generated the most modest amount of oil of the surveyed countries. (6) _____________________ (mặc dù) a slight increase in 2000, oil production in the country remained stable at less than 1 million barrels per day. DETAIL 2: 4 QUỐC GIA CÒN LẠI (CHỈ MÔ TẢ ĐIỂM ĐẦU VÀ CUỐI) The other countries also saw a (7) _____________________ (không đáng kể) rise in oil production over the period. In the initial year, the estimated figure for Iran was about 3 million barrels per day, compared with around 2 million barrels in the other three countries. At the end of the period, the amount of oil produced reached a peak of 4 million barrels in Iran and of near to 4 million barrels in Iraq, Qatar and UAE. ANSWER KEY 1. 2. 3. 4. 5. 6. 7. starting off from/ beginning at to then peaking at/ reaching a peak of in contrast/ by contrast despite (+ Ving/ N phrase) >< Althoug/ Though + S + V minimal/ insignificant/ negligible 7


