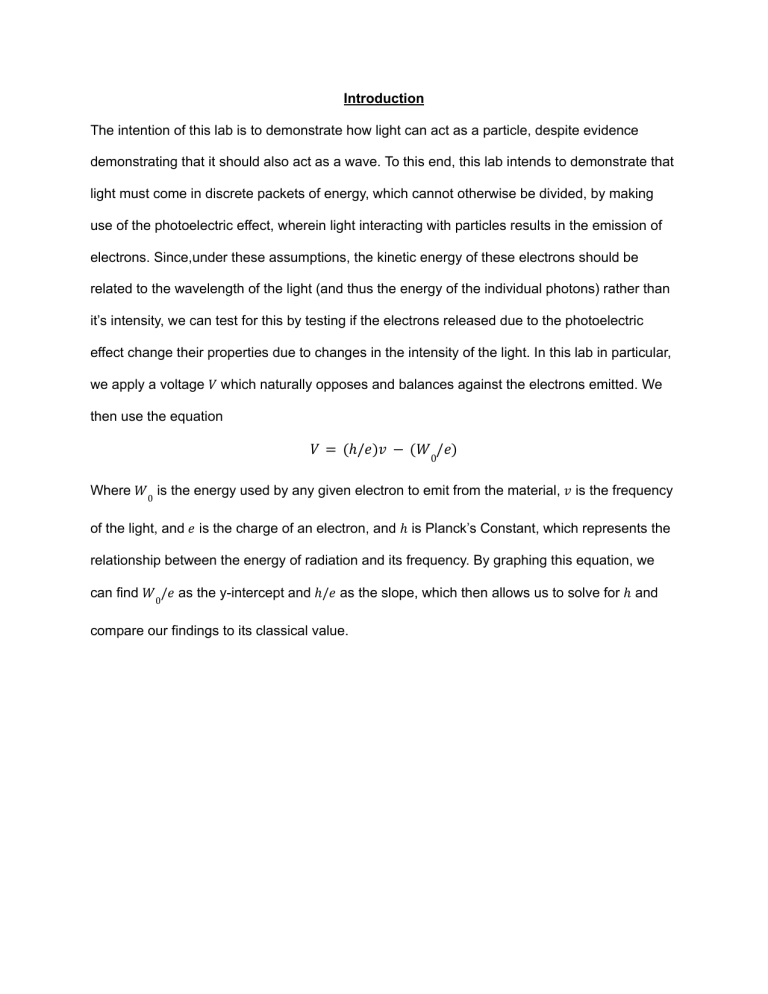
Introduction The intention of this lab is to demonstrate how light can act as a particle, despite evidence demonstrating that it should also act as a wave. To this end, this lab intends to demonstrate that light must come in discrete packets of energy, which cannot otherwise be divided, by making use of the photoelectric effect, wherein light interacting with particles results in the emission of electrons. Since,under these assumptions, the kinetic energy of these electrons should be related to the wavelength of the light (and thus the energy of the individual photons) rather than it’s intensity, we can test for this by testing if the electrons released due to the photoelectric effect change their properties due to changes in the intensity of the light. In this lab in particular, we apply a voltage 𝑉 which naturally opposes and balances against the electrons emitted. We then use the equation 𝑉 = (ℎ/𝑒)𝑣 − (𝑊0/𝑒) Where 𝑊0 is the energy used by any given electron to emit from the material, 𝑣 is the frequency of the light, and 𝑒 is the charge of an electron, and ℎ is Planck’s Constant, which represents the relationship between the energy of radiation and its frequency. By graphing this equation, we can find 𝑊0/𝑒 as the y-intercept and ℎ/𝑒 as the slope, which then allows us to solve for ℎ and compare our findings to its classical value. Methods and Materials Materials: -Mercury Vapor light source -h/e Apparatus -Filter set (Yellow, Green, Variable Transmission) -Digital Multimeter -Cables Methods: For this experiment, we used a mercury vapor light source to produce light, which we then split into separate colors using a slit and lense. Then, we had an apparatus specifically designed for this purpose, called an h/e apparatus, which could swing in semi circles around the location of the slit.This device can then be attached to a digital multimeter, which, when lined up with a specific band of light, will give us the voltage necessary to repel the electrons for said light. Diagram 1: h/e apparatus setup Diagram 2: h/e Apparatus Arm Swinging Motion The specific steps are as follows: Part 1: 1. Turn off all lights to reduce outside interference in the h/e apparatus. 2. Adjust the h/e apparatus until a single band of light is lined up against the slot in the front. This can be done by swinging the h/e apparatus around the light source using the attached arm, as seen in diagram 2. If the color of light you chose is yellow or green, place the corresponding color filter onto the magnetic front plate. 3. Take the variable transmission filter and place it onto the h/e apparatus’ magnetic front plate such that the beam of light passes through only the 100% section of the filter. 4. Record the DVM voltage and approximately how long it took for the multimeter to reach that voltage after the discharge button has been pressed. 5. Repeat step 3 two more times such that you have 3 points of data. 6. Move the variable transmission filter until the light passes through the next section. Repeat steps 3 and 4. 7. Repeat step 5 until you have recorded three data points for each section of the variable transmission filter. 8. Repeat steps 2-6 with a second color. Part 2: 1. Adjust the h/e apparatus until the yellow band of light is lined up with the slot. Place the yellow filter on the magnetic front of the device. 2. Record the DVM. 3. Alter the position of the apparatus and then realign it with the yellow beam, then record the DVM voltage. Repeat such that you have 3 data points. 4. Repeat steps 1–3 with every color in the first order. 5. Repeat steps 1-4, except adjust the h/e apparatus such that it lines up with color bands from the second order, rather than the first. Results and Analysis Yellow Blue % Transmission Stopping Potential (Volts) Charge Time (s) 100 0.733±0.000 19±1.5 80 0.730±0.001 29.67±3.5 60 0.730±0.0005 39.67±7 40 0.730±0.0005 51.67±3.5 20 0.724±0.0005 75±12.5 % Transmission Stopping Potential Charge Time 100 1.396±0.002 16±1 80 1.394±0.0055 18.67±2 60 1.397±0.001 21±6.5 40 1.394±0.001 25.67±1 20 1.381±0.003 34.33±5 Stopping Potentials First Order Second Order Yellow 0.730±0.001 0.735±0.002 Green 0.818±0.012 0.816±0.005 Blue 1.401±0.007 1.416±0.0095 Violet 1.591±0.005 1.587±0.0075 Ultraviolet 1.847±0.0025 1.828±0.006 As shown by the first 2 graphs, placing the variable transmission filter onto the h/e machine had little to no effect on the stopping potential, and therefore the maximum energy of the electrons released due to the photoelectric effect. However, as the percent transmission went down, the charging time went noticeably higher. This was shown for all colors tested, however each individual color had a separate stopping potential, with colors with lower wavelengths/higher frequencies having a notably higher stopping potential than those with lower frequencies; for example, the stopping potential of ultraviolet light was ~2.5 times higher than the stopping potential of yellow light in the same conditions. I believe this collectively supports the quantum model of light, as the stopping potential would only remain the same despite lower intensities if light came in discrete particles, rather than a wave. The fact that the time it took to reach the stopping potentials increased supports this idea, as it demonstrates that the energy of the photoelectrons is not decreasing individually, but there are still fewer of them being emitted as the intensity of the light is decreased. The slight drop in the stopping potential in the 20 and 40 percent light intensity range might be due to the circumstances of the setup: since the h/e machine is based off of an equilibrium between the stopping voltage and the photoelectrons, it might simply be that there are too few high energy electrons being emitted to maintain this equilibrium when the light intensity gets too low. −5 Figure 2: Avg. Stopping Potential vs. Frequency (σ𝑏 = 1 × 10 ) As stated previously, by creating the above graph and finding its slope and y intercept, we can interpret those aspects as the ℎ/𝑒 ratio and the 𝑊0/𝑒 ratio respectively, allowing us to now calculate ℎ and 𝑊0 as shown: −15 ℎ = (ℎ/𝑒)𝑒 = (3. 81 × 10 −34 )𝑒 = 6. 104 × 10 −19 𝑊0 = (𝑊0/𝑒)𝑒 = (− 1. 25)𝑒 = 2. 003 × 10 𝐽 = 1. 24 𝑒𝑉 Conclusions −34 Comparing our experimental value for Planck’s Constant (6. 104 × 10 ) and the accepted one −34 (6. 626 × 10 ), we find that we were fairly close to the modern value of h. When calculated, the percent error for our experimental value is found to be 7.88%, well within the expected error. The work function being 1.25 eV is seemingly not ideal, however, but without an expected value to compare, it is difficult to say how accurate this is. Overall, I believe this lab went well considering the accuracy of our value for the Planck’s Constant, and I believe the small discrepancy in our values can come down to our lab equipment simply not being as accurate as professional lab equipment would be. The only way I could think to improve this lab would be to standardize the environment and equipment more. For instance, somehow taking the data while there is absolutely no extra light in the room would be better, but more importantly, giving the equipment both a cleaning and time to warm up more would be better, as some of the data points taken early in the experiment had to be redone due to the mercury lamp seemingly not being completely warmed up, and others we simply had to accept not ideal conditions due to the filters being somewhat dirty.
