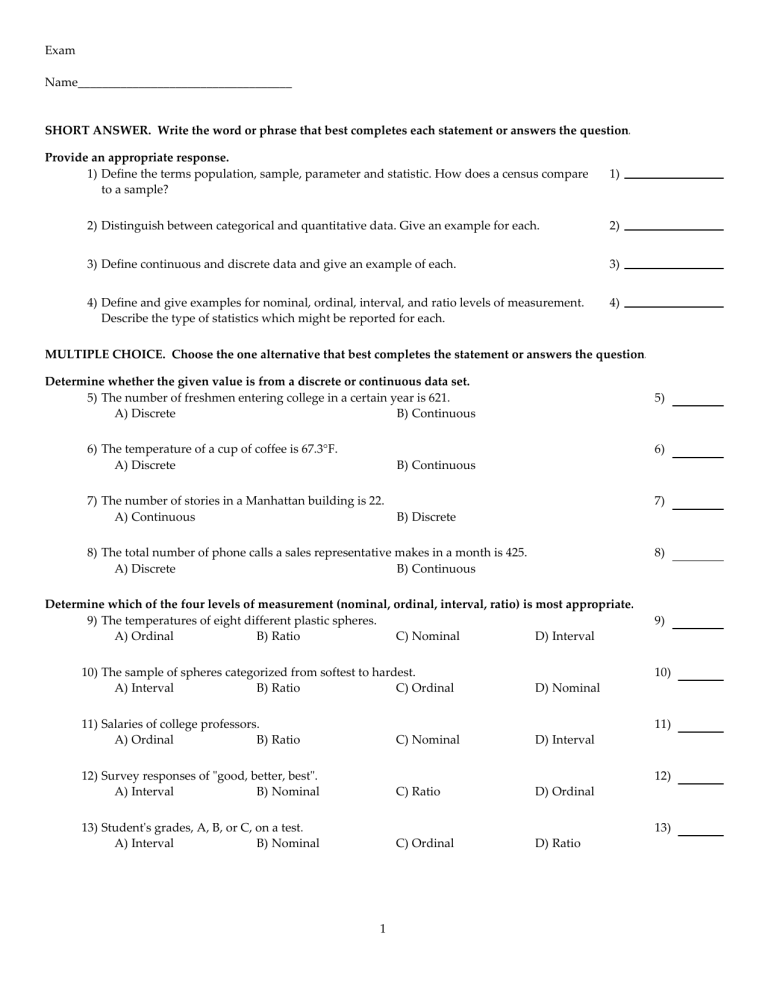
Exam Name___________________________________ SHORT ANSWER. Write the word or phrase that best completes each statement or answers the question. Provide an appropriate response. 1) Define the terms population, sample, parameter and statistic. How does a census compare to a sample? 1) 2) Distinguish between categorical and quantitative data. Give an example for each. 2) 3) Define continuous and discrete data and give an example of each. 3) 4) Define and give examples for nominal, ordinal, interval, and ratio levels of measurement. Describe the type of statistics which might be reported for each. 4) MULTIPLE CHOICE. Choose the one alternative that best completes the statement or answers the question. Determine whether the given value is from a discrete or continuous data set. 5) The number of freshmen entering college in a certain year is 621. A) Discrete B) Continuous 6) The temperature of a cup of coffee is 67.3°F. A) Discrete B) Continuous 7) The number of stories in a Manhattan building is 22. A) Continuous B) Discrete 5) 6) 7) 8) The total number of phone calls a sales representative makes in a month is 425. A) Discrete B) Continuous 8) Determine which of the four levels of measurement (nominal, ordinal, interval, ratio) is most appropriate. 9) The temperatures of eight different plastic spheres. A) Ordinal B) Ratio C) Nominal D) Interval 10) The sample of spheres categorized from softest to hardest. A) Interval B) Ratio C) Ordinal D) Nominal 11) Salaries of college professors. A) Ordinal B) Ratio C) Nominal D) Interval 12) Survey responses of "good, better, best". A) Interval B) Nominal C) Ratio D) Ordinal 13) Student's grades, A, B, or C, on a test. A) Interval B) Nominal C) Ordinal D) Ratio 9) 10) 11) 12) 13) 1 14) Amount of fat (in grams) in cookies. A) Ordinal B) Ratio 14) C) Interval D) Nominal Provide an appropriate response. 15) The table below shows the number of new AIDS cases in the U.S. in each of the years 1989-1994. Year 1989 1990 1991 1992 1993 1994 15) New AIDS cases 33,643 41,761 43,771 45,961 103,463 61,301 Classify the study as either descriptive or inferential. A) Descriptive B) Inferential Answer the question. 16) A magazine publisher mails a survey to every subscriber asking about the quality of its subscription service. The total number of subscribers represents what? A) The population B) The sample 16) 17) A magazine publisher mails a survey to every subscriber asking about the timeliness of its subscription service. The publisher finds that only 3% of the subscribers responded. This 3% represents what? A) The population B) The sample 17) 18) An employee at the local ice cream parlor asks three customers if they like chocolate ice cream. Identify the sample and population. A) Sample: all customers; population: the 3 selected customers B) Sample: the 3 selected customers; population: the customers who like chocolate ice cream C) Sample: the customers who like chocolate ice cream; population: all customers D) Sample: the 3 selected customers; population: all customers 18) 2 Answer Key Testname: PRACTICE1 1) A population is the complete collection of all elements. A sample is a subset of elements drawn from a population. A parameter is a numerical measurement describing some characteristic of a population. A statistic is a numerical measurement describing some characteristic of a sample. A census is the collection of data from every element in a population; a sample is a subset of a population. 2) Qualitative data can be separated into categories that are distinguished by nonnumeric characteristics. Quantitative data consist of numbers representing counts or measurements. Examples will vary. 3) Continuous numerical data result from infinitely many possible values that can be associated with points on a continuous scale so that there are no gaps or interruptions. Discrete data result from either a finite number of possible values or a countable number of possible values. Examples will vary. 4) Nominal: characterized by data that consist of names, labels, or categories. There is no order to nominal data. Ordinal: involves data that may be arranged in some order, but differences between data values cannot be determined or are meaningless. Interval: like ordinal but having meaningful amounts of differences between data, although there is no inherent zero starting point. Ratio: like interval, but there does exist an inherent zero starting point. For nominal or ordinal data, we should not calculate averages or variances, but report only percents. 5) A 6) B 7) B 8) A 9) D 10) C 11) B 12) D 13) C 14) B 15) A 16) A 17) B 18) D 3
