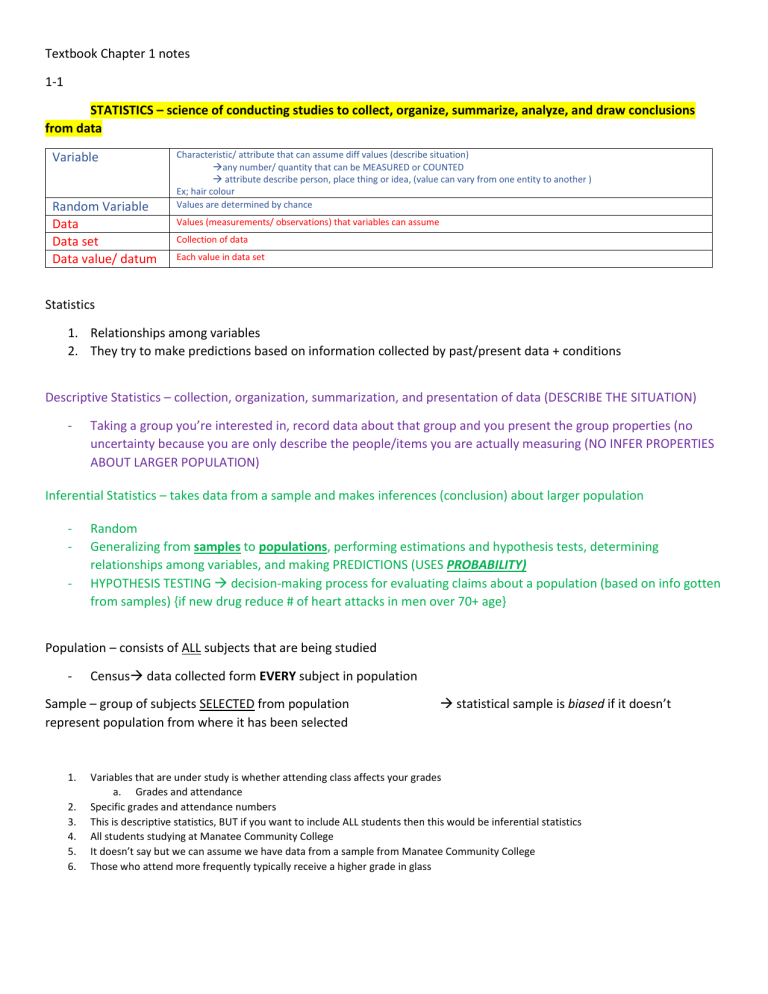
Textbook Chapter 1 notes
1-1
STATISTICS – science of conducting studies to collect, organize, summarize, analyze, and draw conclusions
from data
Variable
Random Variable
Data
Data set
Data value/ datum
Characteristic/ attribute that can assume diff values (describe situation)
any number/ quantity that can be MEASURED or COUNTED
attribute describe person, place thing or idea, (value can vary from one entity to another )
Ex; hair colour
Values are determined by chance
Values (measurements/ observations) that variables can assume
Collection of data
Each value in data set
Statistics
1. Relationships among variables
2. They try to make predictions based on information collected by past/present data + conditions
Descriptive Statistics – collection, organization, summarization, and presentation of data (DESCRIBE THE SITUATION)
-
Taking a group you’re interested in, record data about that group and you present the group properties (no
uncertainty because you are only describe the people/items you are actually measuring (NO INFER PROPERTIES
ABOUT LARGER POPULATION)
Inferential Statistics – takes data from a sample and makes inferences (conclusion) about larger population
-
Random
Generalizing from samples to populations, performing estimations and hypothesis tests, determining
relationships among variables, and making PREDICTIONS (USES PROBABILITY)
HYPOTHESIS TESTING decision-making process for evaluating claims about a population (based on info gotten
from samples) {if new drug reduce # of heart attacks in men over 70+ age}
Population – consists of ALL subjects that are being studied
-
Census data collected form EVERY subject in population
Sample – group of subjects SELECTED from population
represent population from where it has been selected
1.
2.
3.
4.
5.
6.
statistical sample is biased if it doesn’t
Variables that are under study is whether attending class affects your grades
a. Grades and attendance
Specific grades and attendance numbers
This is descriptive statistics, BUT if you want to include ALL students then this would be inferential statistics
All students studying at Manatee Community College
It doesn’t say but we can assume we have data from a sample from Manatee Community College
Those who attend more frequently typically receive a higher grade in glass
1-2 Variables and Types of Data
Qualitative
Variables that have distinct categories according to characteristics/ attribute
Quantitative
Variables that can be COUNTED or MEASURED
Ex; hair colour, gender, geographic locations, religious preference, jersey number {number has no
meaning/ no counting or measurement involved}
Ex; # of frogs, distance frog can jump, temp of frog, age
-
Can be classified into 2 groups: discrete and continuous
Discrete – Values can be counted & assigned
Continuous – Infinite # of values between any 2 specific values
values like 0, 1, 2, 3 and are said to be
(often obtained by measuring and have fractions + decimals)
countable (clear spaces between values)
Ex; can be .1, .5
E; only WHOLE numbers,,,, 1, 5
Distance frog jumps in contest (2.7m) or temp of frog
# of frog in jumping contest
** are rounded bc of limited of measuring device **
# of children in family, # students in
classroom
PRACTICE FOR CONTINUOUS AND DISCRETE: https://quizlet.com/186707020/statistics-test-1-chapters-1-3-flash-cards/
Boundary – data value placed before data value was rounded (answers rounded to nearest given unit)
-
Ex; Actual data is 73.5 but would be rounded to 74 but would be included in class w boundaries of 73.5 up to but
not including 74.5 (written as 73.5 – 74.5)
Boundaries of continuous variable are given 1 additional decimal place and always end w/ digit 5.
Practice:
a. 17.6 inches boundaries 16.55 – 17.65 inches
b. 23 Fahrenheit boundaries 22.5 – 23.5 F
c. 154.62 mg/dl 153.625 154.635
a. 17.65 inches 17.55 – 17.65
b. 154.62 154.615 154.625
CONT 1-2
In addition to being classified as qualitative/ quantitative, variables can be classified by how they are categorized, counted or
measured.
-
Categorized – ex; area of residence (rural, suburban, urban)
Ranked – ex; first place, second place, third place
Measured – ex; heights, IQs or temperature
Measurement scales – how variables are categorized, counted or measured (4 common types of scales)
a.
b.
c.
d.
Nominal
Ordinal
Interval
Ratio
Nominal
(no rank/ order)
NO ranking or ORDER can be placed on data
Classifies data into mutually exclusive (nonoverlapping) categories where no order/ ranking can
be placed on data
Examples
-
Ordinal
(placed in
ordered/ ranked
categories)
Sample of college instructors classified according to subject taught
Survey subjects as male or female
Political party
Religion
Marital status
Residents according to zip codes
(English, history, math, psych)
(democratic, republican, independent)
(Christianity, Judaism, Islam)
(single, married, divorced, widowed, separated)
(alltho #’s are assigned, there is no meaningful order/ ranking)
Data can be placed into categories and these categories can be ordered or ranked
However, precise differences between ranks do not exist
Examples
-
From student evaluations, guest speakers can be ranked as superior, average or poor’
Runners can be ranked as first, second, or third place
Letter grades (A, B, C, D, F)
***precise measurement of differences does not exist***
when people are classified according to their build (small, med, large) a large variation exists among individuals in each class
Interval
(Ranks data +
precise
difference, NO
ZERO)
Ranks data, AND precise differences between units of measure do exist
However, there is no meaningful zero
Examples
-
Standarized psychological tests yield values on interval scale
IQ (there is a meaningful diff of 1 point between IQ 109 and IQ 110
Temperature (there is a meaningful diff of 1 C between 72C and 73C)
***one property lacking in interval scale; there is no true zero***
IQ tests do not measure people who have no intelligence
For temp, 0 C does not mean no heat at all
Ratio
Possess all characteristics of interval and true zero exists
Have true ratio between values
True ratios exist when same variable is measured on 2 diff member of population
Examples
One person can lift 200 lbs and another can lift 100 lbs; thus ratio between them is 2 to 1, aka; the 1 st person can lift twice as much as 2nd person
Measure height, weight, area, and # of phone calls received
No complete agreement about classification of data; some classify IQ as ratio data rather than interval. (Data can be
altered so they fit into a diff category)
-
Ex; If incomes of all professors of a college are classified into 3 categories of low, average and high, then ratio
variable becomes ordinal variable.
1. Fatalities and the industry
2. Fatalities – Quantitative
Industry – Qualitative
3. # fatalities Discrete (can’t have half an injury)
4. Fatalities – Ordinal NO Ratio -level
Industry – Nominal
5. No, fewer people take railway as a form of transportation
6. Convenience, cost, service, availability
1-3 Data Collection and Sampling Techniques
Data can be collected in many ways but most common is through surveys.
- 3 most common are telephone survey, mailed questionnaire and personal interview
TMPSD
Telephone
PRO: Less costly, more candid (since no face-to-face contact)
CON: People may not have phones or will not answer when calls are made
Thus not all people have a change of being surveyed
Many people have unlisted numbers/ cellphones
Tone may influence response of interviewee
PRO: Cover wider geographic area than interview & telephone since they are less expensive to conduct,
respondents can remain anonymous
CON: Low # of responses/ inappropriate answer to questions, people may have difficulty reading or
understanding questions
Mailed
Personal
Interview
PRO: Obtain in-depth responses
CON: Interviewers must b trained in asking q’s and recording responses, interviewer may be biased in selection
of respondents
Thus more costly compared to other 2 survey methods
Surveying
Records
Direct
Observation
Samples cannot be selected in haphazard ways bc info obtained may be biased.
This is why we use 4 methods of sampling (RSSCC)
Random
All members of population have equal chance of being selected
-
Systematic
Chance methods or assign random numbers
(ex; # each subject in population)
Selected by random numbers
Select every kth member of population where k is a counting number
First deciding on a whole number K t hat is between 1 and size of population, then every kth member of
population is selected
Advantage of selecting subjects through ordered population; FAST and CONVENIENT if population can be easily
numbered
-
Must be careful about how subjects in population are numbered; if they were arranged in wife, husband, wife, husband then sample
would be all husbands
Researchers select every 10th item from assembly line to test for defects
(ex; 2000 subject in population and you need sample of 50 subjects; 2000/50 = 40 then k=40 and every 40th subject would be
selected
Stratified
Using every kth number after 1st subject is randomly selected from 1 through k
Divide population into subgroups/ strata according to some characteristic relevant to study (can be several
subgroups) then subjects are randomly selected from each subgroup
-
Samples in strata should be randomly selected
(ex; President of 2-year college wants to learn how students feel about a certain issue and they wish to see if opinions of 1st year
students differ from 2nd year students THUS president will randomly select students from each subgroup
Dividing population into subgroups(strata) according to characteristic relevant to study, and subjects are
randomly selected within subgroups
Cluster
Divide population into sections/ clusters then selecting 1 or more clusters at random and using ALL members in the
cluster(s) as members of sample (miniature population)
Used when population is large or when it involves subjects residing in large geographic area
- Ex; studying patients in hospital in NYC, it would be v costly/ time-consuming to obtain random sample of patients bc they would be
spread over large area; thus few hospitals could be selected at random and patients in these hospitals are interviewed in a cluster
instead
Divide population into sections then 1 or more sections chosen at random and all members of sections are
selected for sample
Although they save time and money, researcher must be aware that cluster does not represent population
Other Sampling methods
1. Convenience sample
a. Can be representative of population; used ONLY if researcher investigates characteristics of population
and determines that sample is representative
Ex; interview subjects entering mall to determine nature of visit or what stores they will be
shopping at
NOT representative of general customers bc probably taken at specific time/day so not all
customers have chance of being selected and thus only representative of population
2. Volunteer sample/ self-selected
a. Respondents decide for themselves if they want to be included in sample
i. Ex; Radio station asks question about a situation and asks people to call if they agree or call
another number if they disagree (most often, people w/ strong opinions will call
-
Since samples are not perfect representatives of populations, this is a sampling error.
o Sampling error: Difference between results obtained from sample AND results obtained from population
from where the sample was selected DIFFERENCE BETWEEN SAMPLE MEASURE & POPULATION
MEASURE
i.
o
Ex; Select sample of full-time students are find 56% but admissions office say only 54%
are female
Non-sampling error: Data is obtained erroneously (INCORRECTLY) or if sample is biased
(nonrepresentative) RESULT OF COLLECTED DATA INCORRECTLY OR SELECTING BIASED SAMPLE
i.
Recording errors can be made OR researcher wrote incorrect data value
ii.
Ex; Data collected using defective scale; each weight off by 2lbs
1-4 Experimental Design
Explain difference between observation and experimental study
Observational
-
-
Researcher only observes what is happening/ what has
happened in past and tries to draw conclusions based on
observations
CANNOT MANIPULATE VARIABLES
3 Types of Observational Studies CRL
1. Cross-Sectional – Data collected at ONE TIME
2. Retrospective – Data collected from PAST records
Longitudinal – Data collected over a PERIOD OF TIME
(past & present)
Experimental
-
-
Researcher manipulates one of the variables and tries
to determine how manipulation influences other
variables
In a true experimental study, researchers have the
control to assign subjects to groups RANDOMLY; THUS
when random assignment isn’t possible, researchers
use intact groups (often done in education in form of
existing classrooms known as
Quasi-experimental study – Study using intact groups
rather than random assignment of subjects to groups
Ex; Divide female students into 2 groups: 1 told “Do
your best” while other group was told to increase # of
situps each day by 10% (manipulated variables=type
of instructions given to each group)
ADVANTAGES
ADVANTAGES
Researcher can decide how to select subjects & how to
Usually occurs in natural setting
assign them to groups (ex, control & treatment groups)
Can be used in situations where intervention by researcher
Ex;
would be considered as unethical/ dangerous (crime
Can manipulate variables such as dosages in medical
statistics study rapes, suicides, murders etc)
studies (researcher can determine precise dosage and
Can be done using variables that CANNOT be manipulated
if needed, vary the dosage
by researcher (studies involving height age, race)
Ex; drug users vs nondrug users ;;;; right hand vs left hand
DISADVANTAGES
Since variables cannot be controlled, THUS the cause and
effect relationship cannot be shown (since researcher
cannot manipulate other influencing variables)
Research can be inaccurate due to data gathered from
cases of historical data like crime statistics from 1800’s or
health statistics from another country
Can be expensive & time consuming
Ex; study of lions
DISADVANTAGES
Occur in unnatural settings (laboratories, special
classrooms) thus results might not apply to natural
setting
EX: mouthwash kill 10,000 germs in test tube but what
about your mouth
HAWTHORNE EFFECT – effect on outcome variable bc
subjects of study know they are participating in the
study
Statistical studies usually include 1 OR MORE independent variables & 1 dependent variable
Independent Variable
– CAN be controlled/ manipulated
a. Explanatory variable – Variable
manipulated to see if it affects
outcome variable
Independent variable is type of
instruction
Dependent Variable
– CANNOT be controlled/ manipulated = used to identify effects of
independent variable
o Outcome Variable – variable studied to see if it changed
significantly due to manipulation of explanatory variable
Dependent variable is the results # of situps of each group after
4 days of exercise
If the differences in the dependent/ outcome
variable, they can be due to the manipulation of
the independent variable (specific instructions
shown to increase athletic performance
EX; In situp study, 2 diff types of instructions (general & specific).
Treatment group – Received some type of treatment (instructions for improvement)
Control group – Not given any treatment
PROBLEM WITH STATISTICAL STUDIES
Confounding of variables/ lurking variables
Placebo effect
– variable that influences outcome variable but
CANNOT be separated form other variables that
influence the outcome variable
– Subjects in study respond favourable/ show improvement bc
they have been selected for study OR they react to clues given
unintentionally by researchers
a. EX; 3 groups; 1st & 2nd group had surgery to remove
damaged cartilage while 3rd group had simulated
surgery. Then, equal # of patients in each group
felt better BUT 3rd group w/ simulated surgery
reponded to PLACEBO EFFECT
- To help eliminate placebo effect, researchers use BLINDING.
BLINDING – subjects do not know whether they are receiving
actual treatment or placebo (ex; sugar pill looks like real pill)
DOUBLE BLINDING – Subjects & researchers not told which groups
are given placebos
- Influences results of research study when no
precautions were taken to eliminate it from
study
a. EX: Subjects who are put on
exercise program may improve
their diet (w/o researcher
knowing) and improve their
health in others ways (not due
to exercise alone) THUS diet =
confounding variable
(subjects respond favourably when given placebo)
Randomization is used to help eliminate confounding variables since randomly assigning subjects tends to “balance out”
inconsistencies (age, social class etc) that each subject brings to study
Researchers use blocking to minimize variability
-
Ex; Situp study. If we think men & women would respond diff to “do your best” vs “increase 10% every day” you
divide subjects into 2 blocks (men, women)
Blocking
Used to minimize variability
- Ex; Situp study. If we think men & women would respond diff to “do your best” vs
“increase 10% every day” you divide subjects into 2 blocks (men, women)
Completely
randomized design
Matched-pair
design
Subjects assigned to groups & treatments are assigned randomly
Replication
1st & 2nd subjects paired according to certain characteristics then 1st subject assigned to
treatment group and 2nd subject assigned to control group
can be paired such as age, height, and weight
- Ex; Using identical twins and assigning each twin to different groups
Same experiment is done in another part of country/ diff laboratory
Used to determine if results apply in diff settings.
Specific procedure to obtain valid results
1.
2.
3.
4.
5.
6.
7.
Formulate purpose of study
Identify variables of study
Define population
Decide sampling method to collect data
Collect data
Summarize data & perform any statistical calculations needed
Interpret the results
Explain how statistics can be used/ misused
Diff ways:
How Statistics can be used/ misused
Suspect samples
– make sure sample size is large enough and need to see how subjects in sample were selected
Studies using volunteers may have a built-in bias (volunteers generally don’t represent
population; may be recruited from a particular socioeconomic background
Ex; 3 out of 4 doctors recommend pain reliever A (if sample only had 4 doctors, the data set is not
large enough to draw a significant conclusion
- Sample of 100 doctors might yield more reliable results
- but if 100 doctors were selected at a meeting sponsored by Pain reliever A, results may be
biased = unreliable results
Ex; Educational studies use students in intact classrooms bc it’s convenient BUT students in these
classrooms don’t represent the entire school district
= Results from small samples, convenience, or volunteer, care should be used when generalizing
results to entire population
Ambiguous Averages
– 4 commonly used measures that are loosely called averages.
1. Mean
2. Median
3. Mode
4. Midrange
Changing the Subject
Detached Statistics
– Different values used to represent same data
- Ex; President who is running for reelection says “during my time, costs increased a mere 3%”
BUT opponent might say “during his time, costs increased a whopping $6,000,000. Although
both figures are correct, 3% vs 6,000,000 makes it sound like a v large increase
- it is misleading
– No comparison is made
- “Our chips has 1/3 less calories” 1/3 less calories than what?
- “Brand A aspirin works 4x faster”
4x faster than what?
Implied Connections
– Imply connections between variables that may not actually exist
- “Eating fish may help to reduce your cholesterol” no guarantee that eating fish will reduce
your cholesterol
- “Studies suggest that our exercise machine will reduce your weight” no guarantee
- “Taking calcium will lower your BP in some people” you may not be included in the group of
“some people”
Misleading Graphs
If graphs are drawn inappropriately, they can misrepresent data and lead the reader to draw false
conclusions
(As statistical graphs give a visual of the data, it allows viewers to analyze/ interpret data easier than
by looking at numbers)
VOCAB:
Blinding
Blocking
Boundary
Census
Cluster Sample

