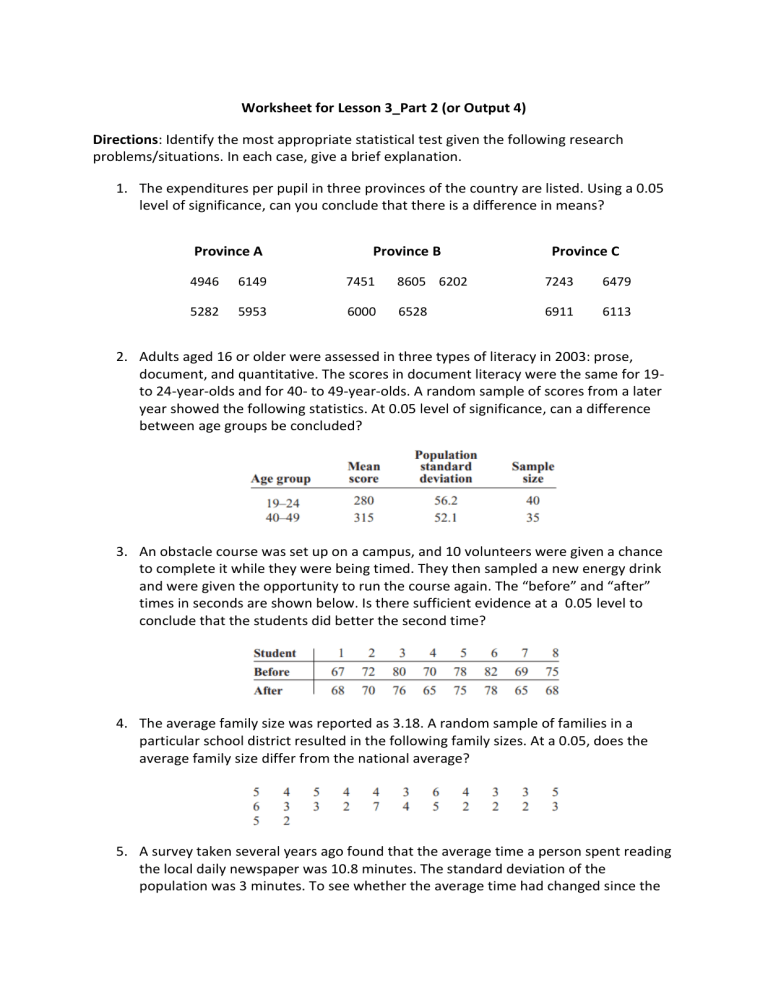
Worksheet for Lesson 3_Part 2 (or Output 4) Directions: Identify the most appropriate statistical test given the following research problems/situations. In each case, give a brief explanation. 1. The expenditures per pupil in three provinces of the country are listed. Using a 0.05 level of significance, can you conclude that there is a difference in means? Province A Province B Province C 4946 6149 7451 8605 6202 7243 6479 5282 5953 6000 6528 6911 6113 2. Adults aged 16 or older were assessed in three types of literacy in 2003: prose, document, and quantitative. The scores in document literacy were the same for 19to 24-year-olds and for 40- to 49-year-olds. A random sample of scores from a later year showed the following statistics. At 0.05 level of significance, can a difference between age groups be concluded? 3. An obstacle course was set up on a campus, and 10 volunteers were given a chance to complete it while they were being timed. They then sampled a new energy drink and were given the opportunity to run the course again. The “before” and “after” times in seconds are shown below. Is there sufficient evidence at a 0.05 level to conclude that the students did better the second time? 4. The average family size was reported as 3.18. A random sample of families in a particular school district resulted in the following family sizes. At a 0.05, does the average family size differ from the national average? 5. A survey taken several years ago found that the average time a person spent reading the local daily newspaper was 10.8 minutes. The standard deviation of the population was 3 minutes. To see whether the average time had changed since the newspaper’s format was revised, the newspaper editor surveyed 36 individuals. The average time that the 36 people spent reading the paper was 12.2 minutes. At 0.05, is there a change in the average time an individual spends reading the newspaper? 6. According to Nielsen Media Research, children (ages 2–11) spend an average of 21 hours 30 minutes watching television per week while teens (ages 12–17) spend an average of 20 hours 40 minutes. Based on the sample statistics obtained below, is there sufficient evidence to conclude a difference in average television watching times between the two groups? Use 0.01 level of significance. 7. A survey found that 83% of the men questioned preferred computer-assisted instruction to lecture and 75% of the women preferred computer-assisted instruction to lecture. There were 100 individuals in each sample. At 0.05 level, test the claim that there is no difference in the proportion of men and the proportion of women who favor computer-assisted instruction over lecture. 8. The percentages of adults 25 years of age and older who have completed 4 or more years of college are 23.6% for females and 27.8% for males. A random sample of women and men who were 25 years old or older was surveyed with these results. At 0.01 level, can it be concluded that there is a difference between these groups? 9. A survey of 800 recent degree recipients found that 155 received associate degrees; 450, bachelor degrees; 20, first professional degrees; 160, master degrees; and 15, doctorates. Is there sufficient evidence to conclude that at least one of the proportions differs from a report which stated that 23.3% were associate degrees; 51.1%, bachelor degrees; 3%, first professional degrees; 20.6%, master degrees; and 2%, doctorates? Use 0.05 level of significance. 10. The table below shows the number of students (in thousands) participating in various programs at both two-year and four-year institutions. At 0.05 level, can it be concluded that there is a relationship between program of study and type of institution? 11. A statistics instructor wanted to see if student participation in review preparation methods led to higher examination scores. Five students were randomly selected and placed in each test group for a three-week unit on statistical inference. Everyone took the same examination at the end of the unit, and the resulting scores are shown below. Is there sufficient evidence at 0.05 level to conclude an interaction between the two factors? Is there sufficient evidence to conclude a difference in mean scores based on formula delivery system? Is there sufficient evidence to conclude a difference in mean scores based on the review organization technique? 12. The number of faculty and the number of students are shown for a random selection of small colleges. At 0.05 level, is there a significant relationship between the two variables? 13. A study claims that all adults spend an average of 14 hours or more on chores during a weekend. A researcher wanted to check if this claim is true. A random sample of 200 adults taken by this researcher showed that these adults spend an average of 14.65 hours on chores during a weekend. The population standard deviation is known to be 3.0 hours. At 0.05 level, is the claim true? 14. The president of a university claims that the mean time spent partying by all students at this university is not more than 7 hours per week. A random sample of 40 students taken from this university showed that they spent an average of 9.50 hours partying the previous week with a standard deviation of 2.3 hours. Test at the 0.05 significance level whether the president’s claim is true. 15. Many students graduate from college deeply in debt from student loans, credit card debts, and so on. A sociologist took a random sample of 401 single persons, classified them by gender, and asked, “Would you consider marrying someone who was Php 2,500,000 or more in debt?” The results of this survey are shown in the following table. Test at the 1% significance level whether gender and response are related. 16. The data given in the table below are the midterm scores in a course for a sample of 10 students and the scores of student evaluations of the instructor. (In the instructor evaluation scores, 1 is the lowest and 4 is the highest score.)Predict the midterm score in terms of the instructor score. 17. A university employment office wants to compare the time taken by graduates with three different majors to find their first full-time job after graduation. The following table lists the time (in days) taken to find their first full-time job after graduation for a random sample of eight business majors, seven computer science majors, and six engineering majors who graduated in May 2020. At the 5% significance level, can you conclude that the mean time taken to find their first full-time job for all May 2020 graduates in these fields is the same? 18. In a sample of 50 men, 44 said that they had less leisure time today than they had 10 years ago. In a sample of 50 women, 48 women said that they had less leisure time than they had 10 years ago. At 0.05 level, is there a difference in the proportions? 19. According to Nielsen Media Research, children (ages 2–11) spend an average of 21 hours 30 minutes watching television per week while teens (ages 12–17) spend an average of 20 hours 40 minutes. Based on the sample statistics obtained below, is there sufficient evidence to conclude a difference in average television watching times between the two groups? Use 0.01 level of significance. 20. This table lists the numbers of officers and enlisted personnel for women in the military. At 0.05 level, is there sufficient evidence to conclude that a relationship exists between rank and branch of the Armed Forces?


