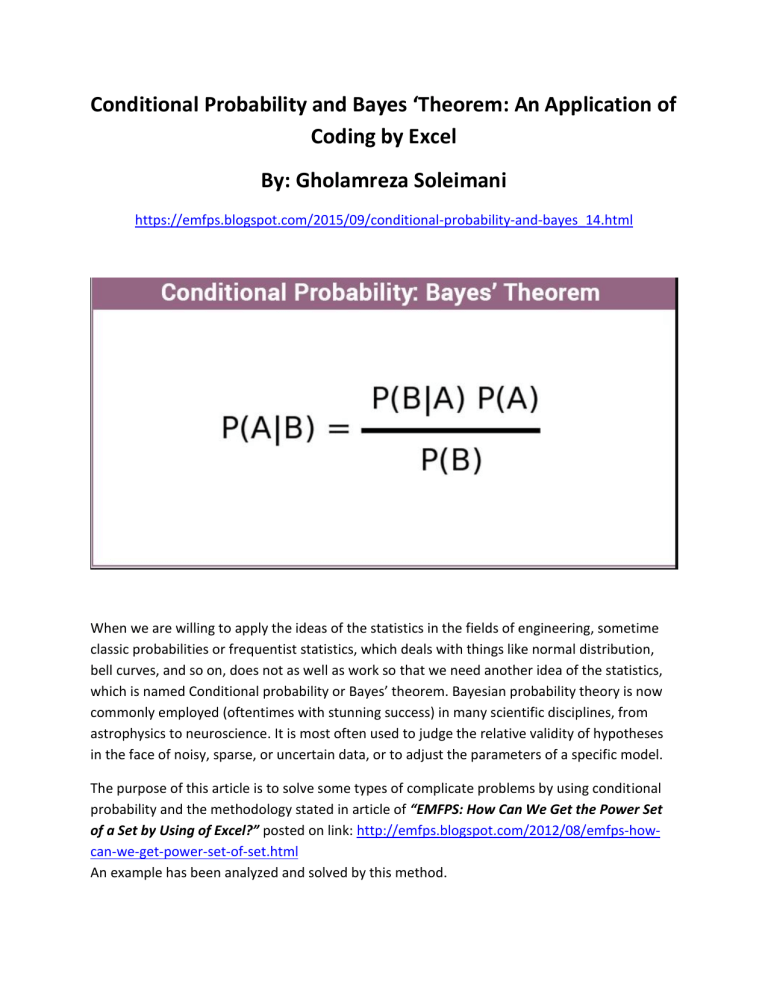
Conditional Probability and Bayes ‘Theorem: An Application of Coding by Excel By: Gholamreza Soleimani https://emfps.blogspot.com/2015/09/conditional-probability-and-bayes_14.html When we are willing to apply the ideas of the statistics in the fields of engineering, sometime classic probabilities or frequentist statistics, which deals with things like normal distribution, bell curves, and so on, does not as well as work so that we need another idea of the statistics, which is named Conditional probability or Bayes’ theorem. Bayesian probability theory is now commonly employed (oftentimes with stunning success) in many scientific disciplines, from astrophysics to neuroscience. It is most often used to judge the relative validity of hypotheses in the face of noisy, sparse, or uncertain data, or to adjust the parameters of a specific model. The purpose of this article is to solve some types of complicate problems by using conditional probability and the methodology stated in article of “EMFPS: How Can We Get the Power Set of a Set by Using of Excel?” posted on link: http://emfps.blogspot.com/2012/08/emfps-howcan-we-get-power-set-of-set.html An example has been analyzed and solved by this method. Introduction Conditional probability is referred to probability of an event or outcome based on the occurrence of a previous event or outcome. Conditional probability is calculated by multiplying the probability of the preceding event by the updated probability of the succeeding event. Consider the events of “A” and “B”. The probability of event B is calculated by below formula, if event A was already occurred: P (B|A) = P (AÇ B) / P (A) , P (A) > 0 Bayes’ rule really involves nothing more than the manipulation of conditional probabilities. Bayesian probability theory provides a mathematical framework for performing inference, or reasoning, using probability. Bayesian logic is a branch of logic applied to decision making and inferential statistics that deals with probability inference: using the knowledge of prior events to predict future events. Bayes' theorem provided, for the first time, a mathematical method that could be used to calculate, given occurrences in prior trials, the likelihood of a target occurrence in future trials. According to Bayesian logic, the only way to quantify a situation with an uncertain outcome is through determining its probability. Bayes' Theorem is a means of quantifying uncertainty. Based on probability theory, the theorem defines a rule for refining a hypothesis by factoring in additional evidence and background information, and leads to a number representing the degree of probability that the hypothesis is true. According to Andrew Anderson (2012), Bayesian analysis is the use of conditional or evidential probabilities. It looks at what you know of the environment and past knowledge, and allows you to infer probabilities based off of that data. Here is an example that shows us the difference between classic probability and Bayesian approach: In a company, the population of females is 32%, so that means that if I select someone at random from my office, I have a 32% chance of picking a female. The chances are purely based on the total probability. The Bayesian approach is to rely on past knowledge and then adjust accordingly. If I know that 25% of my office is male, and I grab a person, then I know that I have a 75% chance of picking a female. So is it 32% or 75%? Both are correct answers depending on what question you are really asking, but both look at things differently. Now, let me bring a complicate case and analyze it by using of the method posted on link: http://emfps.blogspot.com/2012/08/emfps-how-can-we-get-power-set-of-set.html Case: Assume we have a box including 7 green balls and 5 red balls. We reach in and pull out 4 balls. If there is the probability of P (A) that 3 balls from 4 are green then, what is the probability of fourth ball that will be red? Solution: Conceptualize: Imagine we have two events A and B in which they are defined as follows: A = event of 3 green balls from 4 balls B = event of one red ball from 4 balls Categorize: We should calculate P (B|A) by using of below formula: P (B|A) = P (AÇ B) / P (A) , P (A) > 0 How can we calculate P (AÇ B) and P (A)? In this case, I used from coding system in excel. In fact, I gave to any random ball into box a number. Therefore, we have 12 balls which each one has a number of 1 to 12. Since we have 4 balls from 12, I obtained all combinations or binomial [12, 4] or C (12, 4) because we have not any repetition and also the replacement does not matter, if we assign to any random ball a number. Finally, I calculated above probabilities step by step as follows: Analyze: Let me start step by step this method by using of excel: Ø Type “c” into cell A1 in your spreadsheet Ø Type into cell A2 the number of choices which is 4 Ø Type into cells of: A3 = 1 A4 = 2 A5 =3 A6 =4 A7 =5 A8 = 6 A9 =7 A10 =8 A11 =9 A12= 10 A13= 11 A14 = 12 Ø Now, we can run macro from VB code written by Myrna Larson to obtain all combinations. You can find this code on link: http://emfps.blogspot.com/2012/08/emfps-how-can-we-getpower-set-of-set.html There are two methods to solve this problem as follows: Method of event A: Ø Type formula: =IF(A1<=7,1,0) on cell F1. Because we have 7 green balls Ø Draw above formula for G1, H1 and I1 and also draw down all four cells for 495 columns Ø Type formula: =IF(SUM(F1:I1)=3,1,0) on cell J1 and formula: =IF(SUM(F1:I1)>=3,1,0) on cell K1 and also draw down all two cells for 495 columns Ø On cell J496 type formula: =SUM(J1:J495) and on cell K496 type formula: =SUM(K1:K495) Ø Now, we can calculate the probabilities as follows: Ø P (AÇ B) = cell J496 / 495 = 0.353535354 Ø P (A) = cell K496 / 495 = 0.424242424 Ø P (B|A) = 0.83333333 Method of event B: Ø Type formula: =IF (A1<=5, 1, 0) on cell F1. Because we have 5 red balls Ø Draw above formula for G1, H1 and I1 and also draw down all four cells for 495 columns Ø Type formula: =IF(SUM(F1:I1)=1,1,0) on cell J1 and formula: =IF(SUM(F1:I1)<=1,1,0) on cell K1 and also draw down all two cells for 495 columns Ø On cell J496 type formula: =SUM(J1:J495) and on cell K496 type formula: =SUM(K1:K495) Ø Now, we can calculate the probabilities as follows: Ø P (AÇ B) = cell J496 / 495 = 0.353535354 Ø P (A) = cell K496 / 495 = 0.424242424 Ø P (B|A) = 0.83333333 In the next articles, I will bring you the examples of real world in the field of engineering (Turbo molecular pumps) and also in the field of strategic management (External Real Forces and Pseudo-Forces to Design a Strategic Plan).


