Elementary Statistics Test: Normal Distribution & Confidence Intervals
advertisement
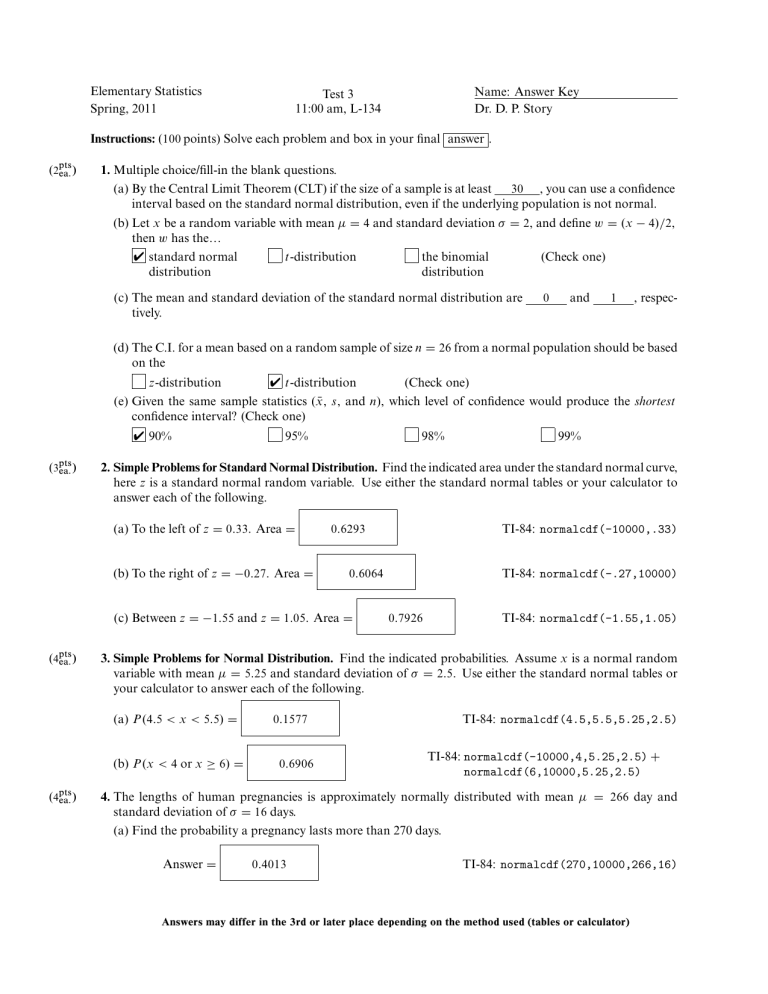
Elementary Statistics Spring, 2011 Name: Answer Key Dr. D. P. Story Test 3 11:00 am, L-134 Instructions: (100 points) Solve each problem and box in your final answer . (2pts ea. ) 1. Multiple choice/fill-in the blank questions. (a) By the Central Limit Theorem (CLT) if the size of a sample is at least 30 , you can use a confidence interval based on the standard normal distribution, even if the underlying population is not normal. (b) Let x be a random variable with mean μ = 4 and standard deviation σ = 2, and define w = (x − 4)/2, then w has the… ✔ standard normal t -distribution the binomial (Check one) distribution distribution (c) The mean and standard deviation of the standard normal distribution are tively. 0 and 1 , respec- (d) The C.I. for a mean based on a random sample of size n = 26 from a normal population should be based on the z-distribution ✔ t -distribution (Check one) (e) Given the same sample statistics (x̄, s, and n), which level of confidence would produce the shortest confidence interval? (Check one) ✔ 90% (3pts ea. ) 95% 98% 2. Simple Problems for Standard Normal Distribution. Find the indicated area under the standard normal curve, here z is a standard normal random variable. Use either the standard normal tables or your calculator to answer each of the following. (a) To the left of z = 0.33. Area = (b) To the right of z = −0.27. Area = 0.6293 TI-84: normalcdf(-.27,10000) 0.7926 TI-84: normalcdf(-1.55,1.05) 3. Simple Problems for Normal Distribution. Find the indicated probabilities. Assume x is a normal random variable with mean μ = 5.25 and standard deviation of σ = 2.5. Use either the standard normal tables or your calculator to answer each of the following. (a) P (4.5 < x < 5.5) = (b) P (x < 4 or x ≥ 6) = (4pts ea. ) TI-84: normalcdf(-10000,.33) 0.6064 (c) Between z = −1.55 and z = 1.05. Area = (4pts ea. ) 99% 0.1577 0.6906 TI-84: normalcdf(4.5,5.5,5.25,2.5) TI-84: normalcdf(-10000,4,5.25,2.5) + normalcdf(6,10000,5.25,2.5) 4. The lengths of human pregnancies is approximately normally distributed with mean μ = 266 day and standard deviation of σ = 16 days. (a) Find the probability a pregnancy lasts more than 270 days. Answer = 0.4013 TI-84: normalcdf(270,10000,266,16) Answers may differ in the 3rd or later place depending on the method used (tables or calculator) STA2023/T3 – Page 2 of 4 – Name: Answer Key (b) What proportion of pregnancies lasts between 240 and 280 days? Answer = TI-84: normalcdf(240,280,266,16) ≈ 0.7571 0.7571 (c) Records for 1500 pregnancies are selected at random. How many of these do you expect show a pregnancy of length less than 250 days? Number = 238 Solution: We calculate P (x < 250) = normalcdf(-10000,250,266,16) ≈ 0.1587. The number of people out of 1500 we would expect is 1500 · 0.1587 ≈ 238.05. We round down to 238 (4pts ) 5. Find the z-score that has 25% of the distribution’s area to its right. z-score = (4pts ) TI-84: invNorm(.75) ≈ 0.6745 0.6745 6. The reading speed of sixth-grade students is approximately normal, with a mean of 125 words per minutes and a standard deviation of 24 words per minute. What is the reading speed of a sixth-grader whose reading speed is at the 90th percentile. P90 = 156 Solution: From the z-tables—using inverse look-up—we see that the 90th percentile of the z-distribution is 1.28. Thus, x = μ + σz = 125 + (24)(1.28) = 155.72 ≈ 156 The alternate approach is to use invNorm with its optional arguments (invNorm(p,μ,σ )). P90 = invNorm(.9,125,24) ≈ 155.78 ≈ 156 (10pts ) 7. The upper leg length of 20- to 29-year old males is normally distributed with mean length 43.7 cm and standard deviation 4.2 cm. A random sample of 20 males in this age group are selected, and their mean upper leg length, x̄ is calculated. (a) (4 pts) Calculate the standard deviation of the sample mean x̄: σx̄ = σ 4.2 Note: σx̄ = √ == √ ≈ 0.9391 n 20 0.9391 (b) (4 pts) What is the probability that the mean upper leg length, x̄, is less than 42 cm? P (x̄ < 42) = 0.0351 Solution: We use the calculator functionality, √ P (x̄ < 42) = normalcdf(-10000,42,43.7,4.2/ 20) ≈ 0.0351 (c) (2 pts) If the sample size is increased from n = 20 to n = 40, does the value of P (x̄ < 42) increase or decrease? increase ✔ decrease Answers may differ in the 3rd or later place depending on the method used (tables or calculator) STA2023/T3 (5pts ) – Page 3 of 4 – Name: Answer Key 8. Find the margin of error for the given values of c = 0.95, s = 3.25 and n = 30. Margin of Error = 1.163 σ 3.25 Solution: We have E = zc √ ≈ (1.96) √ ≈ 1.163 Another way of solving this problem is by calculator: n 30 Using the ZInterval procedure, enter σ = 3.25, x̄ = 0, and n = 30. The C.I. you get is centered around 0 (zero). The upper endpoint, 1.163, is also the value of E. (Believe it or not!) (8pts ) 9. A random sample of 190 users of MySpace.com found the mean time spent online during month of July, 2010, was 171.0 minutes, with standard deviation of 36.5 minutes. Construct a 90% confidence interval for the amount of time spent online by MySpace.com users. 90% C.I. = 166.64 , 175.36 Solution: We have (1.645)(36.5) E= √ ≈ 4.356 190 and so x̄ − E = 171.0 − 4.356 = 166.64 x̄ + E = 171.0 + 4.356 = 175.36 Alternately, we can report the results using the ZInterval procedure. (5pts ) 10. Determine the minimal required sample size if you want to be 99% confident that the sample mean is within 0.5 of the population mean. Assume that σ ≈ 5.6. n= 832 Solution: We have z σ 2 2.575 · 5.6 2 c ≈ ≈ 831.75 n= E 0.5 Rounding up we get n = 832. (8pts ) 11. An arborist is interested in determining the mean diameter of mature white oak trees, and takes measurements on 7 randomly selected mature white oak trees: 64.0, 33.4, 45.8, 56.0, 51.5, 29.2, 63.7 Each value represents the diameter 1 meter above the base of the tree. Assuming the data for the diameters of trees is normally distributed, construct a 95% confident interval for the mean diameter of a mature white oak trees. 95% C.I. = 36.3 , 61.8 Solution: The mean and standard deviation for the data set is x̄ ≈ 49.1 and s ≈ 13.8. For the t -distribution with d.f. = 6, we have t95 = 2.447 s 13.8 E = tc √ = (2.447) √ ≈ 12.76 n 7 and so x̄ − E = 49.1 − 12.76 = 36.34 and x̄ + E = 49.1 + 12.76 = 61.86 The problem can also be solved by the TInterval procedure. The mean and standard deviation are computed using the 1-Var Stats functions or by the TInterval procedure. Answers may differ in the 3rd or later place depending on the method used (tables or calculator) STA2023/T3 (5pts ) – Page 4 of 4 – Name: Answer Key 12. Quick C.I. Construct a 95% confidence interval for μ using the t-distribution with the data: x̄ = 13.4, s = 0.85, n = 8. Solve using either technology (calculator) or using the t-tables. 95% C.I. = 12.7 , 14.1 Solution: We use TInterval, the input screen is Inpt: Stats x̄: 13.4 sx : .82 n: 8 The output screen shows the C.I. to be (12.689, 14.111) (4pts ) 13. In a survey of 4813 U.S. adult Internet users, 2021 said they have high-speed Internet access in their homes. Find the point estimate, p̂, for the proportion of adults who have access to high-speed Internet; and find the point estimate, q̂, for the proportion of adults who do not have access to high-speed Internet. x 2021 = ≈ 0.42 n 4813 p̂ = 0.42 Calculations: p̂ = q̂ = 0.58 Calculations: q̂ = 1 − p̂ ≈ 1 − 0.42 ≈ 0.58 Express your answer as a decimal, rounded to two digits. (8pts ) 14. For the survey (and data) described in Problem 13, construct a 95% confidence interval for the proportion of U.S. adults who have high-speed Internet access in their home. 95% C.I. = 0.40596 , 0.43385 Solution: We use the 1-PropZInt procedure. The input screen is x: 2021 n: 4813 C-Level: .95 The results are (0.40596, 0.43385) Common formula Margins of Error for various confidence intervals σ s E = zc √ ≈ zc √ n n Sample Sizes z σ 2 c , σ ≈s n= E s E = tc √ n E = zc p̂ q̂ n Convert z-values to x-values x = μ + σz Answers may differ in the 3rd or later place depending on the method used (tables or calculator)

