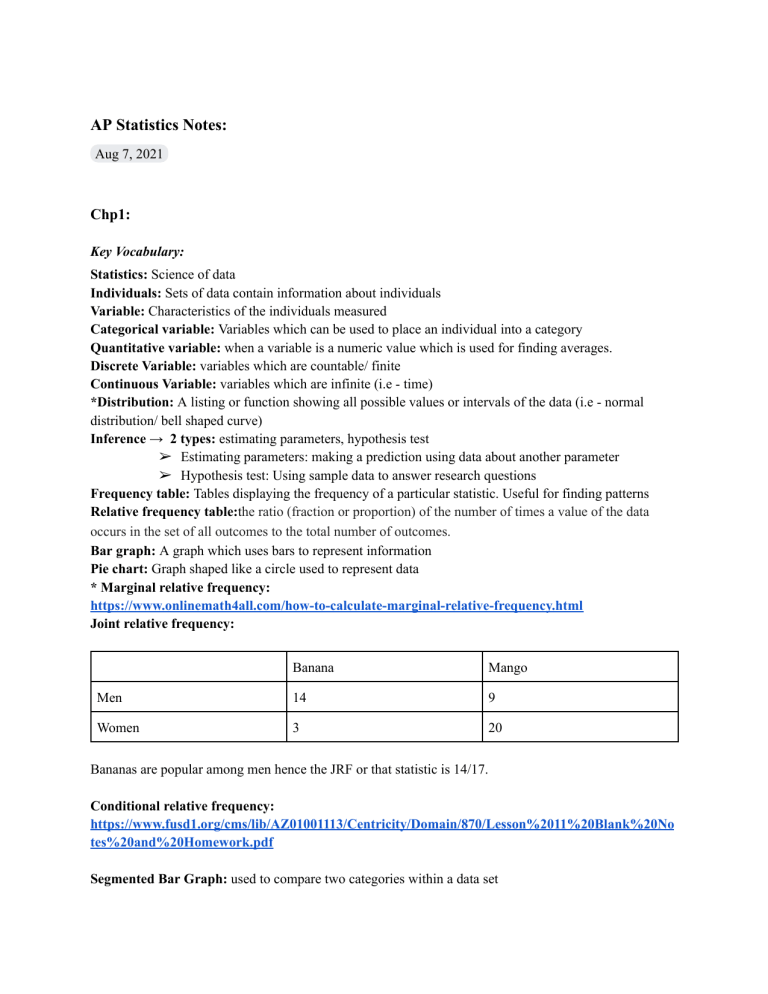
AP Statistics Notes: Aug 7, 2021 Chp1: Key Vocabulary: Statistics: Science of data Individuals: Sets of data contain information about individuals Variable: Characteristics of the individuals measured Categorical variable: Variables which can be used to place an individual into a category Quantitative variable: when a variable is a numeric value which is used for finding averages. Discrete Variable: variables which are countable/ finite Continuous Variable: variables which are infinite (i.e - time) *Distribution: A listing or function showing all possible values or intervals of the data (i.e - normal distribution/ bell shaped curve) Inference → 2 types: estimating parameters, hypothesis test ➢ Estimating parameters: making a prediction using data about another parameter ➢ Hypothesis test: Using sample data to answer research questions Frequency table: Tables displaying the frequency of a particular statistic. Useful for finding patterns Relative frequency table:the ratio (fraction or proportion) of the number of times a value of the data occurs in the set of all outcomes to the total number of outcomes. Bar graph: A graph which uses bars to represent information Pie chart: Graph shaped like a circle used to represent data * Marginal relative frequency: https://www.onlinemath4all.com/how-to-calculate-marginal-relative-frequency.html Joint relative frequency: Banana Mango Men 14 9 Women 3 20 Bananas are popular among men hence the JRF or that statistic is 14/17. Conditional relative frequency: https://www.fusd1.org/cms/lib/AZ01001113/Centricity/Domain/870/Lesson%2011%20Blank%20No tes%20and%20Homework.pdf Segmented Bar Graph: used to compare two categories within a data set Mosaic Plot: A mosaic plot is a graphical display that allows you to examine the relationship among two or more categorical variables. Association: shows correlation (or absence of it) between two variables Mean: avg. found by adding all numbers and dividing by num of values Median: the middle number in a sorted, ascending or descending, list of numbers Range: The difference between the lowest and highest values. Standard Deviation: The Standard Deviation is a measure of how spread out numbers are. Quartiles: the values that divide a list of numbers into quarters: Interquartile range (IQR): The range from Quartile 1 to Quartile 3 Five-number summary: The smallest number in the set, largest number, median, Q1, and Q3. Link to finding these numbers: https://www.statisticshowto.com/statistics-basics/how-to-find-a-five-number-summary-in-statistics/ Boxplot: a graph that gives you a good indication of how the values in the data are spread out Individuals and Variables: Data sets contain info abt individuals Characteristics of individuals measured → variables Types of Variables: 2 categories → categorical/ quantitative Categorical: when variables are used to place an individual into a group/category Quantitative: when a variable is a numeric value which is used for finding averages. Displaying Categorical Data: Frequency table → displays counts/ %s of individuals Graphical displays > tables (easier to read and highlight important information of distribution) Pie charts/ Bar graphs → used for displaying categorical data Dot Plots/ Stemplots → Pros: ➢ easiest to construct ➢ helpful for describing distributions ➢ Keeps data intact (i.e - individual data can be determined directly from plot) ➢ When comparing data, stemplots/ dot plots of the same scale can be constructed ➢ Plots always require a label for axes and a key Cons: ➢ Difficult to construct with larger data sets Histograms → displays frequency of values that fall within equal-width classes. Useful for large data sets SOCV : Used to analyze the shape of the data Shape Outliers Center Variability Questions asked to analyze: ➢ Is it symmetric or skewed? ➢ Num of peaks? ➢ What is its center? ➢ How variable is the data? ➢ Are values bunched up at center or spread out? ➢ Any outliers? ➢ Any values skewed from the majority? Exploratory Data Analysis (EDA): Used to organize, examine, describe data: ➢ ➢ ➢ ➢ ➢ Examine each variable by itself Plot data Begin with a graph/graphs Add numeric summaries Use SOCV Mean VS Median: Mean isn’t always an accurate measure of the center of the data as extreme values can influence the mean. The median is more accurate as it isn;t swayed by extreme values. If the data is more symmetrical the mean and median should be close to each other. This is why it is important to analyze data before calculating the center. Measures of Variability and Boxplots: Describe variability of a distribution → calculating range (maximum - minimum). Large values can cause the measure to be inaccurate Better way to calculate variability → Interquartile range (IQR) Day 1 Notes: Definitions Sample: a subset of individuals in the population from which we collect data. Convenience Sampling: Collecting data from individuals nearby. Often produces unrepresentative data. Simple random sampling A simple random sample (SRS) of size n is chosen in such a way that every group of n individuals in the population has an equal chance to be selected as the sample. Voluntary response sampling: Allows people to choose to be part of the sampling Census: collects data from every individual in the population. Population: in a statistical study is the entire group of individuals we want information about


