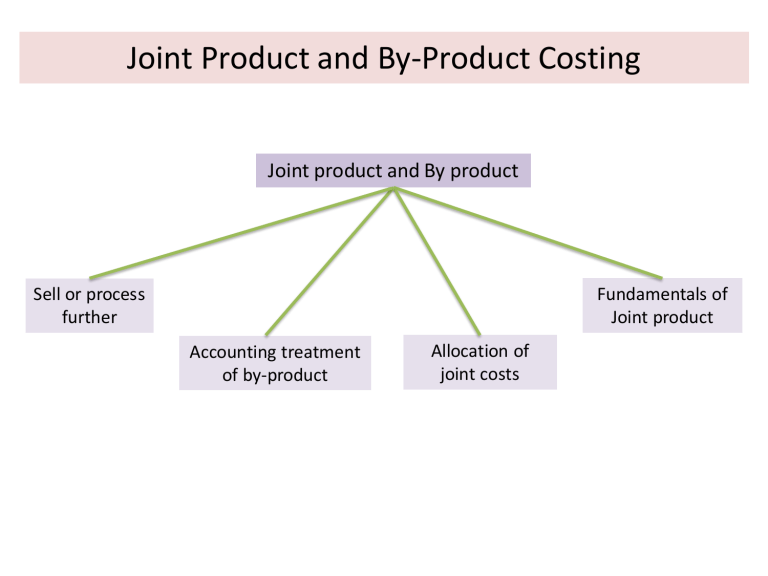
Joint Product and By-Product Costing Joint product and By product Fundamentals of Joint product Sell or process further Accounting treatment of by-product Allocation of joint costs Fundamentals of Joint Product and By-Product • A joint product is manufactured consciously and simultaneously along with the main product. When the production of two or more products are made together with same input and process, these products are termed joint products. They are usually of similar value. Examples of joint products are gasoline, diesel, kerosene, lubricants, paraffin and asphalt obtained from crude oil. Lumber and firewood are also joint products as both of them are produced from the same input. • Whereas the by-product is simply an incidental result of the manufacturing of the main product, and usually has insignificant value in comparison to main product. Put it differently, a by-product is an output that is not a waste, but has low value relative to the main product or coproducts. For example, sawdust is a by-product from lumbering operation and has insignificant value. Basis of Difference Joint products By-products Importance Joint products have equivalent and high importance in the production process By-products have comparatively low importance Value The market value of joints products do not vary significantly The market value of byproducts are significantly low as compared to joint products or main products Input Joint products are manufactured using same input and the input is essentially raw material Wastage or scrap of main products are the input of by-products Further processing Most of the joint products requires further processing Further processing of byproducts is rarely required Objectives Producing joint products is the main objective of production process Producing by-product is not the main objective of production process Joint Cost vs. Common Cost • A joint cost is a cost incurred in a joint process. Joint costs may include direct material, direct labor, and overhead costs incurred during a joint production process. A joint process is a production process in which one input yields multiple outputs. • Common costs are harder to identify, but include all costs that keep the business running but which cannot be attributed to one product, department, project, territory or other specific cost center. Salary paid to factor Allocation of Joint Costs Three methods of allocating joint product costs are: 1. Physical units method 2. Market/Sales value method 3. Net realizable method 4. The constant gross margin percentage method Costs allocated by sales value To allocate joint costs based on the products’ sales value, you should: 1) Calculate the total production costs up until the split-off point – this might include direct labor costs, as well as raw materials and overheads 2) Determine the sales price and volume of all of the resulting products 3) Calculate the relative sales value of each product – the total value of sales for each product, divided by the overall revenue generated by the joint products 4) Assign the joint costs according to the relative sales value Costs allocated by gross margins You can allocate joint costs based on the products’ gross margins. Using this method, you should: 1) Calculate the total processing cost for each joint product after the split-off point 2) Subtract this amount from the total revenue that each product will earn If it’s not possible to determine the sale price of each product at the splitoff point, the gross margin method may be the only option. Accounting Treatment of By-product • There are two ways of accounting for a byproduct: the production method and the sales method. • Under the production method, a product’s sales value is recognized in the accounting period in which the product is produced, and the by-product is considered as inventory. • Under the sales method, the value of the byproduct is recognized in the accounting period in which the product is sold, and the product is not recorded as inventory. An alternative approach A by-product has some commercial value and any income generated from it may be treated as follows: Income (minus any post-separation further processing or selling costs) from the sale of the by- product may be added to sales of the main product, thereby increasing sales turnover for the period. The sales of the by-product may be treated as a separate, incidental source of income against which are set only post-separation costs (if any) of the by-product. The revenue would be recorded in the income statement as 'other income'. The sales income of the by-product may be deducted from the cost of production or cost of sales of the main product. The net realizable value of the by-product may be deducted from the cost of production of the main product. Example During November 2020, SA Co recorded the following results. Opening inventory of main product S, full by-product P, full. Cost of production TK 120,000. Sales of the main product amounted to 90% of output during the period, and 10% of production was held as closing inventory at 30 November. Sales revenue from the main product during November 2019 was TK 150,000. A by-product P is produced, and output had a net sales value of TK 1,000. Of this output, TK 700 was sold during the month, and TK 300 was still in inventory at 30 November. Requirements: Calculate the profit for November using the four methods of accounting for byproducts. (a) Income from by-product added to sales of the main product Sales of main product (TK 150,000 + TK 700) TK 150,700 Opening inventory 0 Cost of production 120,000 Less: Closing inventory (10%) 12,000 Cost of sales 108,000 Profit, main product 42,700 The closing inventory of the by-product has no recorded value in the cost accounts. (b) By-product income treated as a separate source of income Sales of main product TK TK 150,000 Opening inventory 0 Cost of production 120,000 Less: Closing inventory (10%) 12,000 Cost of sales 108,000 Profit, main product 42,000 Other income Total profit 700 42,700 The closing inventory of the by-product again has no value in the cost accounts. c) Sales income of the by-product deducted from the cost of production in the period Sales, main product Opening inventory TK 0 Cost of production (120,000 700) 119,300 Less: Closing inventory (10%) 119,300 11,930 Cost of sales TK 150,000 107,370 42,630 d) Net realisable value of the by-product deducted from the cost of production in the period. Sales, main product Opening inventory Cost of production (120,000 1,000) TK TK 150,000 0 119,000 119,000 Less closing inventory (10%) 11,900 Cost of sales 107,100 Profit, main product 42,900 Sell or process further decision • The sell or process further decision is the choice of selling a product now or processing it further to earn additional revenue. This choice is based on an incremental analysis of whether the additional revenues to be gained will exceed the additional costs to be incurred as part of the additional processing work. • The decision rule for whether to sell or process materials further is: Process further as long as the incremental revenue from processing exceeds the incremental processing costs. Try to solve the problem using the format presented in the previous slide December 2016 4.a & June 2018 3.b Three products P, Q and R are produced together in a common process. Products P and Q are sold without further processing, but product R requires an additional process before it can be sold. No inventories are held. There is no loss of volume in the additional process for product R. The following data apply to March. Output Selling prices Product P Product Q Product R Product P Product Q Product R Costs incurred in the common process Costs incurred in the additional process for R 3,600 litres 4,100 litres 2,800 litres £4·60 per litre £6·75 per litre £10·50 per litre £42,500 £19,600 Required: Calculate the value of the common process costs that would be allocated to product R using the sales proxy method (notional sales value method). Answer to Question no. 4 (a) Post separation costs per unit are £19,600 / 2,800 = £7 per litre Notional price at separation point is £10·50 - £7 = £3·50 per litre Weighted sales value is P Q R 3,600 x £4·60 = 4,100 x £6·75 = 2,800 x £3·50 = £16,560 £27,675 £9,800 £54,035 Allocation of common process costs to R is £42,500 x (£9,800 / £54,035) = £7,708 June 2021 4. b [Horngren 16-25, 16 Ed.] XYZ Company operates a simple chemical process to convert a single material into three separate items, referred to here as A, B and C. All three end products are separated simultaneously at a single split-off point. Products A and B are ready for sale immediately upon split-off point without further processing or any other additional costs. Product C, however, is processed further before being sold. There is no available market price for C at the split-off point. The selling prices quoted here are expected to remain the same in the coming year. During 2019-20, the selling prices of the items and the total amounts sold were: A – 186 tons sold for Tk. 1,500 per ton B – 527 tons sold for Tk. 1,125 per ton C – 736 tons sold for Tk. 750 per ton The total joint manufacturing costs for the year were Tk. 625,000. An additional Tk. 310,000 was spent to finish product C. There were no opening inventories of A, B or C. At the end of the year, the following inventories of complete units were on hand: A 180 tons B 60 tons C 25 tons There was no opening or closing work-in-progress. Required: 1. Compute the cost of inventories of A, B and C for Balance Sheet purpose and cost of goods sold for income statement purpose as of June 30, 2020, using i. NRV Method; ii. Constant Gross Margin Percentage NRV Method. 2. Compute the gross-margin percentages for A, B and C using information computed in 1(i) above. 3. Would it be logical here to apply sales value at split-off point for allocating joint cost? Solution to 4. b 1. i. NRV Method Under Net Realizable Value A B C Units Sold 186 527 736 Ending Inventory 180 60 25 Production 366 587 761 1,500 1,125 750 549000 660375 570750 - - 310,000 Net Realizable Value 549000 660375 260750 Joint Cost Allocation 233,399 280,748 110,853 - - 310,000 233,399 280,748 420,853 637.7022 478.276 553.0263 Cost of Goods Sold 118,613 252,051 407,027 Cost of Ending Inventory 114,786 28,697 13,826 Selling price per ton Sales Revenue Further Processing Cost Further Processing Cost Total Manufacturing Cost Cost per unit Constant Gross Margin Percentage NRV Method: Sales Less: COGS (625,000+310,000) Gross Margin Gross Margin Percentage Sales Less: Gross Margin @ 47.48% COGS Less: Further Processing Costs Joint Costs Allocated Further Processing Cost Total Manufacturing Cost Cost per Unit Cost of Goods Sold Cost of Ending Inventory 1,780,125 935,000 845,125 47.48% A 549000 260641 288359 B 660375 313517 346858 288359 346858 288359 787.866 146,543 141,816 346858 590.8995 311,404 35,454 C 570750 270967 299783 310,000 -10217 310,000 299783 393.933 289,935 9,848 Gross Margin Percentage under NRV Method Under Net Realizable Value A B C Sales Revenue 549000 660375 570750 Less: COGS 118,613 252,051 407,027 Gross Margin 430,387 408,324 163,723 78 62 29 Gross Margin Percentage Sales value at split-off point couldn’t be applied here as there is no market for product C at split-off point. December 2017 1.b [Horngren 16-35, 16 Ed.] Chittagong Sawmill, Limited (CSL), purchases logs from independent timber contractors and processes the logs into three types of lumber products: Studs for residential building (wall, ceiling) Decorative pieces (fireplace mantels, beams for cathedral ceilings) Posts used as support braces (mine support braces, braces for exterior fences around ranch properties) These products are the result of a joint sawmill process that involves removal of bark from the logs, cutting the logs into a workable size (ranging from 8 to 16 feet in length), then cutting the individuals products from the logs, depending on the types of wood(pine, oak, or maple) and the size (diameter) of the log. The joint process results in the following costs and outputs of products for a typical quarter: Direct materials (rough timber logs) Debarking (Labor and overhead) Sizing (labor and overhead) Product cutting (labor and overhead) Total joint costs Tk. 50,00,000 Tk. 5,00,000 Tk. 20,00,000 Tk. 25,00,000 Tk. 1,00,00,000 Products yields and average sales values on a per unit basis from the joint process are as follows: Product Studs Decorative pieces Posts Monthly Output of materialsat Split off point 75,000 units 5,000 units 20,000 units Fully processed sellingprice Tk. 80 Tk. 1,000 Tk. 200 The studs are sold as rough-cut lumber after emerging from the sawmill operation without further processing by CSL. Also, the posts require no further processing beyond the split off point. The decorative pieces must be planned and further sized after emerging from the Sawmill. The additional processing costs Tk. 10,00,000 per month and normally results in a loss of 10% of the units entering the process. Without this planning and sizing process, there is still an active intermediate market for the unfinished decorative pieces in which the selling price average Tk. 600 per unit. 1. Based on the information given for Chittagong Sawmill Ltd. allocate the joint processing costs of Tk. 1,00,00,000 to each of the product line using: a) Sale value at split off point. b) Physical-units method c) NRV method 2. Prepare an analysis for Chittagong Sawmill Ltd. that compares processing the decorative pieces further, as they currently do, with selling them as a rough-cut product immediately at split off. 3. Assume Chittagong Sawmill Ltd. announced that in next six months it will sell the rough* cut product at split off due to increasing competitive pressure. Identify at least three types of likely behavior that will be demonstrated by the skilled labor in the planning and sizing process as a result of this announcement. Include in your discussion how this behavior could be improved by management. Solution to the Q. No. 1 (b) Sales value at split off method: Monthly Unit Selling price per unit Sales Value at % of Sales Joint Costs output split off Allocated Studs 75,000 Tk. 80 Tk. 46.1539% 46,15,39 (Building) 60,00,000 0 Decorative 5,000 600 30,00,000 23.0769 23,07,690 Pieces Posts 20,000 200 40,00,000 30. 7692 30,76,920 Total 1,30,00,000 100,0000% 1,00,00,000 b) Physical measure method at split off: Studs (Building) Physical Unit Volume 75,000 % of Total Unit Volume 75% Joint Costs Allocated Tk. 75,00,000 Decorative Pieces 5,000 5% 5,00,000 Posts 20,000 20% 20.00,000 Total 1,00,000 100% 1,00,00,000 c) Net realizable value method: Studs (Building) Decorative Pieces (b) Posts Total Monthly Unit Output 75,000 4,500 Fully Processed Selling Price Per Unit Tk. 80 1000 20,000 200 Estimated Net % of Joint Costs Realizable Sales Allocated Value Tk. 60,00,000 44.444% Tk. 44,44,450 35,00,000 25.9259 25,92,590 40,00,000 1,35,00,000 29.6296 100% 29,62,960 1,00,00,000 Notes: 5,000 monthly units of output - 10% normal spoilage = 4,500 good units. 4,500 good units XRs 1,000 = Rs 45,00,000 - Further processing costs of Rs 10,00,000 = 35,00,000 2. Presented below is an analysis for Chittagong Sawmill Limited comparing the processing of decorative pieces further versus selling the rough-cut product immediately at split-off. Monthly unit output Less: Normal further processing shrinkage Units available for sale Final sales value (4,500 units X Rs 1,000 per unit) Less: Sales value at split off Incremental revenue Less: Further processing costs Additional contribution from further processing 5,000 500 4,500 Tk. 45,00,000 30,00,000 15,00,000 10,00,000 Tk. 5,00,000 Assuming Chittagong Sawmill Ltd. announces that in six months it will sell the rough-cut product at split-off, due to increasing competitive pressure, at least three types of likely behavior that will be demonstrated by the skilled labor in the planning and sizing process includes the following: Poorer quality. Reduced motivation and morale. Job insecurity, leading to nonproductive employee time looking for jobs elsewhere. Management actions that could improve this behavior include the following: Improve communication by giving the workers a more comprehensive explanation as to the reason for the change so they can better understand the situation and bring out a plan for future operation of the rest of the plant. The company can offer incentive bonuses to maintain quality and production and align rewards with goals. The company could provide job relocation and internal job transfers. April 2019 1.c The ABC Mine is a small mine that extracts coal in Coastal area. Each ton of coal mined is 40% Grade A coal, 40% Grade B coal, and 20% coal tar. All output is sold immediately to a local utility. In May, ABC mined 1,000 tons of coal. It spent Tk. 10,000 on the mining process. Grade A coal sells for Tk. 100 per ton. Grade B coal sells for Tk. 60 per ton. ABC gets one quarter of a vat of coal tar from each ton of coal tar processed. The coal tar sells for Tk. 60 per vat. ABC treats Grade A and Grade B coal as joint products, and treats coal tar as a byproduct. Required: (i) Assume that ABC allocates the joint costs to Grade A and Grade B coal using the Sales value at split-off method and accounts for the byproduct using the production method. What is the inventoriable cost for each product and ABC’s gross margin? (ii) Assume that ABC allocates the joint costs to Grade A and Grade B coal using the Sales value at split-off method and accounts for the byproduct using the sales method. What is the inventoriable cost for each product and ABC’s gross margin? c. i) Sales value at split-off method: Byproduct recognized at time of production method Joint cost to be charged to joint products = Joint Cost – NRV of By product = Tk. 10,000 – 1000 tons×20% × 0.25 vats × Tk. 60 = Tk. 10,000 – 50 vats × Tk. 60 = Tk. 7,000 Grade A Coal Sales value of coal at split-off, 1,000 tons × 0.4 × Tk. 100; 1,000 tons × 0.4 × Tk. 60 Weighting, Tk. 40,000; Tk. 24,000/ Tk. 64,000 Joint costs allocated, 0.625; 0.375 × Tk. 7,000 Gross margin (Sales revenue ─ Allocated cost) Grade B Coal 40,000 24,000 0.625 0.375 4,375 35,625 2,625 21,375 Total 64,000 7,000 57,000 (ii) Sales value at split-off method: Byproduct recognized at time of sale method Joint cost to be charged to joint products = Total Joint Cost = Tk. 10,000. Grade A Grade B Coal Coal Total Sales value of coal split-off 1,000 tons × .4 × Tk. 100; 1,000 tons × .4 × Tk. 60 40,000 24,000 64,000 Weighting, Tk. 40,000; Tk. 24,000¸ Tk. 64,000 0.625 0.375 Joint costs allocated, 0.625; 0.375 × Tk. 10,000 6,250 3,750 10,000 Gross margin (Sales revenue ─ Allocated cost) 33,750 20,250 54,000 Since the entire production is sold during the period, the overall gross margin is the same under the production and sales methods. In particular, under the sales method, the Tk. 3,000 received from the sale of the coal tar is added to the overall revenues, so that Cumberland’s overall gross margin is Tk. 57,000, as in the production method.


