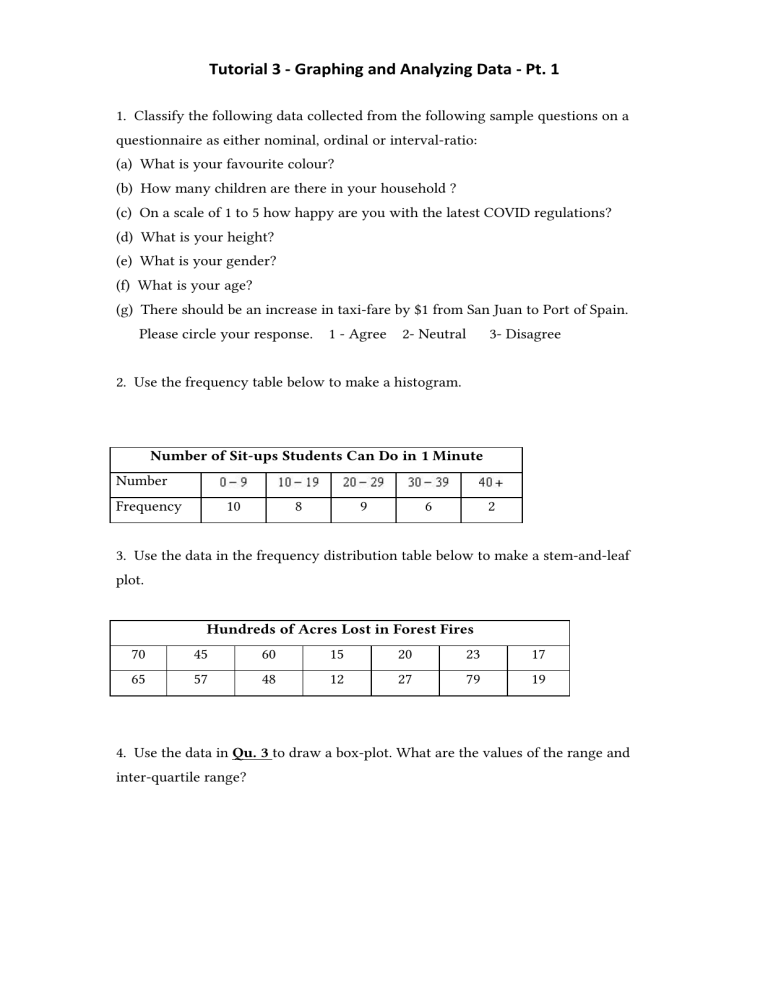
Tutorial 3 - Graphing and Analyzing Data - Pt. 1 1. Classify the following data collected from the following sample questions on a questionnaire as either nominal, ordinal or interval-ratio: (a) What is your favourite colour? (b) How many children are there in your household ? (c) On a scale of 1 to 5 how happy are you with the latest COVID regulations? (d) What is your height? (e) What is your gender? (f) What is your age? (g) There should be an increase in taxi-fare by $1 from San Juan to Port of Spain. Please circle your response. 1 - Agree 2- Neutral 3- Disagree 2. Use the frequency table below to make a histogram. Number of Sit-ups Students Can Do in 1 Minute Number Frequency 10 8 9 6 2 3. Use the data in the frequency distribution table below to make a stem-and-leaf plot. Hundreds of Acres Lost in Forest Fires 70 45 60 15 20 23 17 65 57 48 12 27 79 19 4. Use the data in Qu. 3 to draw a box-plot. What are the values of the range and inter-quartile range?


