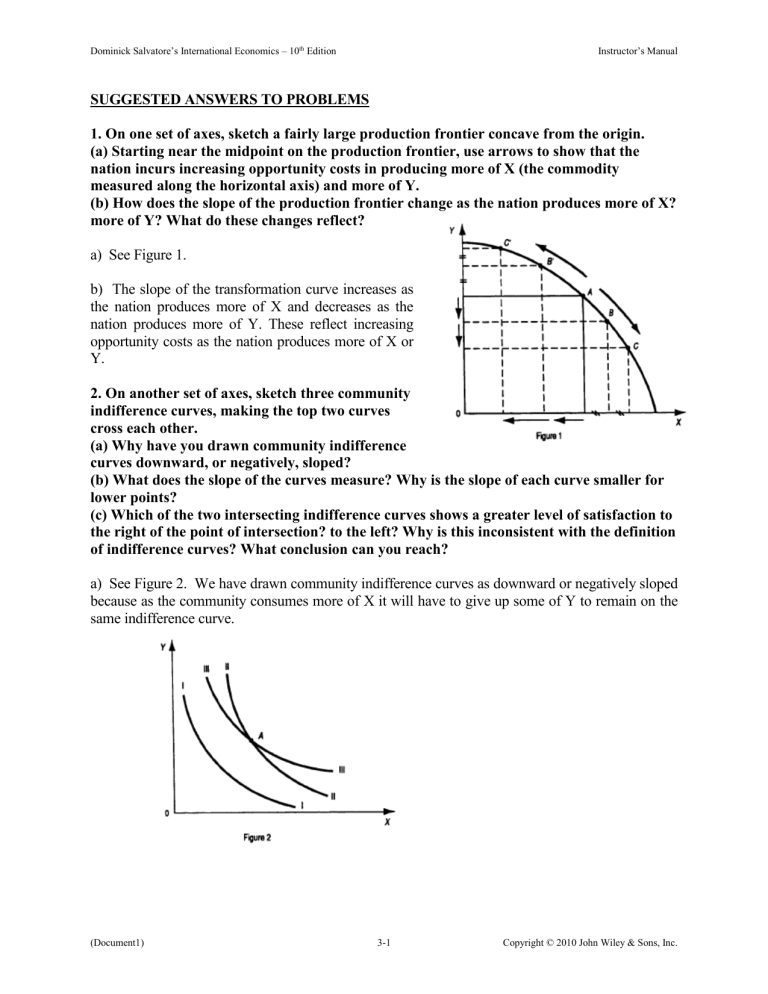
Dominick Salvatore’s International Economics – 10th Edition Instructor’s Manual SUGGESTED ANSWERS TO PROBLEMS 1. On one set of axes, sketch a fairly large production frontier concave from the origin. (a) Starting near the midpoint on the production frontier, use arrows to show that the nation incurs increasing opportunity costs in producing more of X (the commodity measured along the horizontal axis) and more of Y. (b) How does the slope of the production frontier change as the nation produces more of X? more of Y? What do these changes reflect? a) See Figure 1. b) The slope of the transformation curve increases as the nation produces more of X and decreases as the nation produces more of Y. These reflect increasing opportunity costs as the nation produces more of X or Y. 2. On another set of axes, sketch three community indifference curves, making the top two curves cross each other. (a) Why have you drawn community indifference curves downward, or negatively, sloped? (b) What does the slope of the curves measure? Why is the slope of each curve smaller for lower points? (c) Which of the two intersecting indifference curves shows a greater level of satisfaction to the right of the point of intersection? to the left? Why is this inconsistent with the definition of indifference curves? What conclusion can you reach? a) See Figure 2. We have drawn community indifference curves as downward or negatively sloped because as the community consumes more of X it will have to give up some of Y to remain on the same indifference curve. (Document1) 3-1 Copyright © 2010 John Wiley & Sons, Inc. Dominick Salvatore’s International Economics – 10th Edition Instructor’s Manual b) The slope measures how much of Y the nation can give up by consuming one more unit of X and still remain at the same level of satisfaction; the slope declines because the more of X and the less of Y the nation is left with, the less satisfaction it receives from additional units of X and the more satisfaction it receives from each retained unit of Y. c) III > II to the right of the intersection, while II > III to the left. This is inconsistent because an indifference curve should show a given level of satisfaction. Thus, indifference curves cannot cross. *3. On one set of axes, sketch a community indifference curve tangent to the fairly flat section of a concave production frontier. On a second set of axes, sketch another (different) community indifference curve tangent to the fairly steep portion of another (different) concave production frontier. (a) Draw in the line showing the equilibrium-relative commodity price in isolation in each nation. (b) Which is the commodity of comparative advantage for each nation? (c) Under what (unusual) condition would there be no such thing as comparative advantage or disadvantage between the two nations? a) See Figure 3. b) Nation 1 has a comparative advantage in X and Nation 2 in Y. c) If the relative commodity price line has equal slope in both nations. *4. (a) On the graphs of Problem 3, show, for each nation with trade, the direction (by an arrow on the production frontier) of specialization in production and the equilibrium point of production and consumption. (b) How much does each nation gain in consumption compared with its autarky point? Which of the two nations gains more from trade? Why? a) See Figure 4. (Document1) 3-2 Copyright © 2010 John Wiley & Sons, Inc. Dominick Salvatore’s International Economics – 10th Edition Instructor’s Manual b) Nation 1 gains by the amount by which point E is to the right and above point A and Nation 2 by the excess of E' over A'. Nation 1 gains more from trade because the relative price of X with trade differs more from its pre-trade price than for Nation 2. 5. On one set of axes, sketch Nation 1’s supply of exports of commodity X so that the quantity supplied (QS) of X is QSx = 0 at Px/Py = 1/4, QSx = 40 at Px/Py = 1/2, QSx = 60 at Px/PY = 1, and QSx = 70 at Px/Py = 11/2. On the same set of axes, sketch Nation 2’s demand for Nation 1’s exports of commodity X so that the quantity demanded (QD) ofXis QDx = 40 at Px/Py = 11/2,QDx = 60 at Px/PY = 1, and QDx = 120 at Px/Py = 1/2. (a) Determine the equilibrium-relative commodity price of the exports of commodity X with trade. (b) What would happen if Px/PY were 11/2 (c) What would happen if Px/Py = 1/2 a) See Figure 5. In Figure 5, S refers to Nation 1's supply curve of exports of commodity X, while D refers to Nation 2's demand curve for Nation 1's exports of commodity X. D and S intersect at point E, determining the equilibrium PB=Px/Py=1 and the equilibrium quantity of exports of 60X. (Document1) 3-3 Copyright © 2010 John Wiley & Sons, Inc. Dominick Salvatore’s International Economics – 10th Edition Instructor’s Manual b) At Px/Py=1 1/2 there is an excess supply of exports of R'R=30X and Px/Py falls toward equilibrium Px/Py=1. c) At Px/Py=1/2, there is an excess demand of exports of HH'=80X and Px/Py rises toward Px/Py=1. 6. What is the relationship between the figure you sketched for Problem 5 and the results you obtained in Problem 5 and Figure 3.4 in the text? Explain. The Figure in Problem 5 is consistent with Figure 3-4 in the text. From the left panel of Figure 3-4, we see that Nation 1 supplies no exports of commodity X at Px/Py=1/4 (point A). This corresponds with the vertical or price intercept of Nation 1's supply curve of exports of commodity X (point A). The left panel of Figure 4 also shows that at Px/Py=1, Nation 1 is willing to export 60X (point E). The same is shown by Nation 1's supply curve of exports of commodity X. The other points on Nation 1's supply curve of exports in the figure of Problem 5 can also be derived from the left panel of Figure 4, but this is shown in Chapter 4 with offer curves. Nation 2's demand curve for Nation 1's exports of commodity X could be derived from the right panel of Figure 4. What is important is that we can use the D and S figure in Problem 5 to explain why the equilibrium relative commodity price with trade is Px/Py=1 and why the equilibrium quantity traded of commodity X is 60 units in Figure 4. *7. On one set of axes, sketch a community indifference curve tangent to the fairly flat section of a concave production frontier and show the nation’s autarky equilibriumrelative commodity price, labeling it PA. Assume that this graph refers to a very small nation whose trade does not affect relative prices on the world market, given by PW. Show on the graph the process of specialization in the production, the amount traded, and the gains from trade. See Figure 6. (Document1) 3-4 Copyright © 2010 John Wiley & Sons, Inc. Dominick Salvatore’s International Economics – 10th Edition Instructor’s Manual The small nation will move from A to B in production, exports X in exchange for Y so as to reach point E > A. 8. (a) Explain why the small nation of Problem 7 does not specialize completely in the production of the commodity of its comparative advantage. (b) How does your answer to part (a) differ from the constant-cost case? a) The small nation specializes in the production of commodity X only until its opportunity cost and relative price of X equals PW. This usually occurs before the small nation has become completely specialized in production. b) Under constant costs, specialization is always complete for the small nation. 9. On two sets of axes, draw identical concave production frontiers with different community indifference curves tangent to them. (a) Indicate the autarky equilibrium-relative commodity price in each nation. (b) Show the process of specialization in production and mutually beneficial trade. a) See Figure 7. b) See Figure 8. (Document1) 3-5 Copyright © 2010 John Wiley & Sons, Inc. Dominick Salvatore’s International Economics – 10th Edition Instructor’s Manual 10. What would have happened if the two community indifference curves had also been identical in Problem 9? Sketch a graph of this situation. If the two community indifference curves had also been identical in Problem 9 the relative commodity prices would also have been the same in both nations in the absence of trade and no mutually beneficial trade would be possible. (Document1) 3-6 Copyright © 2010 John Wiley & Sons, Inc. Dominick Salvatore’s International Economics – 10th Edition Instructor’s Manual 11. What would happen if the production frontiers are identical and the community indifference curves are different, but we have constant opportunity costs? Draw a graph of this. If production frontiers are identical and the community indifference curves different in the two nations, but we have constant opportunity costs, there would be no mutually beneficial trade possible between the two nations. 12. Draw a figure showing the separation of the gains from exchange from the gains from specialization for Nation 2 in the right panel of Figure 3.4 if Nation 2 were now a small nation. See Figure 11 13. During the negotiations for NAFTA (North American Free Trade Agreement among the United States, Canada, and Mexico) in the early 1990s, opponents argued that the (Document1) 3-7 Copyright © 2010 John Wiley & Sons, Inc. Dominick Salvatore’s International Economics – 10th Edition Instructor’s Manual United States would lose many jobs to Mexico because of the much lower wages in Mexico. What was wrong with this line of reasoning? It is true that Mexico's wages are much lower than U.S. wages (about one fifth), but labor productivity is much higher in the United States and so labor costs are not necessarily higher than in Mexico. In any event, trade can still be based on comparative advantage. * = Answer provided at www.wiley.com/college/salvatore. SUGGESTED ANSWER TO PROBLEMS IN APPENDIX A3.3 Problem Derive from Figure 3.10 Nation 2’s production frontier. Which commodity is L intensive in Nation 2? Why? See Figure 12. Commodity X is the L-intensive commodity in Nation 2 (as in Nation 1) because the production contract curve bulges toward the L-axis or is everywhere to the left of the diagonal. A3.4 Problem Explain why, as Nation 2 moves from point A_ to point B_ on its contract curve (i.e., specializes in the production of Y, the commodity of its comparative advantage), its K/L ratio falls in the production of both X and Y. (If you cannot, reread Section A3.4.) Since L and K are released from the production of X in a higher ratio than are absorbed in the production of Y, wages fall in Nation 2. This leads to the substitution of L for K in the production of X and Y, so that the K/L ratio falls in the production of both commodities. (Document1) 3-8 Copyright © 2010 John Wiley & Sons, Inc.
