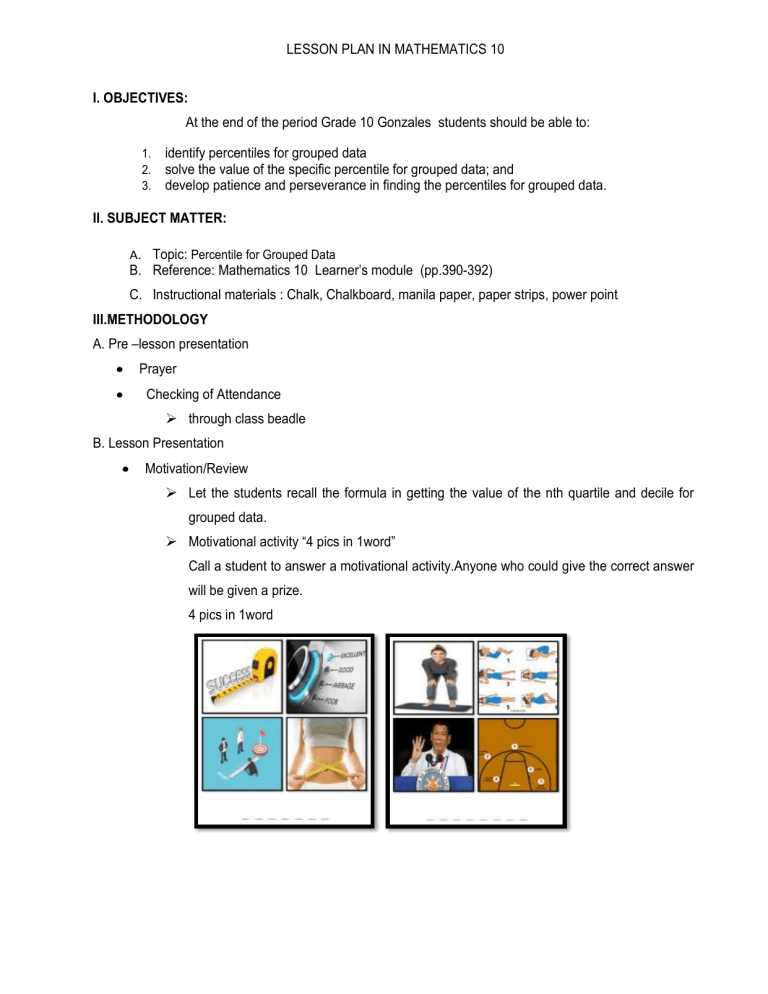
LESSON PLAN IN MATHEMATICS 10 I. OBJECTIVES: At the end of the period Grade 10 Gonzales students should be able to: 1. 2. 3. identify percentiles for grouped data solve the value of the specific percentile for grouped data; and develop patience and perseverance in finding the percentiles for grouped data. II. SUBJECT MATTER: A. Topic: Percentile for Grouped Data B. Reference: Mathematics 10 Learner’s module (pp.390-392) C. Instructional materials : Chalk, Chalkboard, manila paper, paper strips, power point III.METHODOLOGY A. Pre –lesson presentation Prayer Checking of Attendance through class beadle B. Lesson Presentation Motivation/Review Let the students recall the formula in getting the value of the nth quartile and decile for grouped data. Motivational activity “4 pics in 1word” Call a student to answer a motivational activity.Anyone who could give the correct answer will be given a prize. 4 pics in 1word Presentation Let the students create a sentence or phrase using all the words they have formed (possible answer: MEASURE OF POSITION THAT DIVIDES A DISTRIBUTIONINTO 100 EQUAL PARTS) By applying the previous learning . let the student gues the topic for the day.(answer: Percentile) Lesson proper: Post the formula Example #1: Calculate the 65th and 32nd percentile of the Mathematics test scores of 50 students. The teacher will post the the data and let the students complete the table by pasting the strips of papers found under the armchairs. The students sitting in the chair where the strip is placed should be the one to paste it to the right place in the table.A student will be called to answer and explain their work. Scores Frequency 46-50 4 41.45 8 36-40 11 31-35 9 26-20 12 21-25 6 SOLUTION Class Frequency Lower boundary ˂cf 46-50 4 45.5 50 41.45 8 40.5 46 Interval 36-40 11 35.5 39 31-35 9 30.5 27 26-20 12 25.5 18 21-25 6 20.5 6 Enrichment: Group activity In a group of three, students will be given envelop which contains the data distribution found below.Each group should select one representative to present and explain their answer on the board.Each group should be asked to find: Group 1:P50 Group 2; P35 Group 3: P68 Rubrics on Group Activity Criteria Outstanding Satisfactory Developing Beginning 5 points 4 points 3 points 2 points The computations are The computations are The computations are The computations are accurate. A wise use key of accurate. A use key of erroneous.show some use erroneous .do not some concepts is evident concepts evident key of concepts is evident Mathematical The explanation is clear , The explanation is clear The Reasoning exhaustive or thorough . Accuracy explanation use key of concepts is understandable but not logical Generalization Ask a student on how to identify nth percentile of a data. IV - EVALUATION Calculate the 10th, 70th, and 94th percentile of the following grouped data. Class Interval 110 – 119 100 – 109 90 – 99 80 – 89 70 – 79 60 – 69 50 – 59 f 2 5 10 14 16 10 8 N=65 . The explanation is incomplete inconsistent Rating and V- ASSIGNMENT Calculate the 15th, 21st, 32nd, 39th, 48th, 56th, 60th, 75th, 87th, and 94th percentile of the following grouped data. Class Interval f 151 – 160 141 – 150 131 – 140 121 – 130 111 – 120 101 – 110 91 – 100 81 – 90 71 – 80 8 12 6 10 7 11 13 9 4


