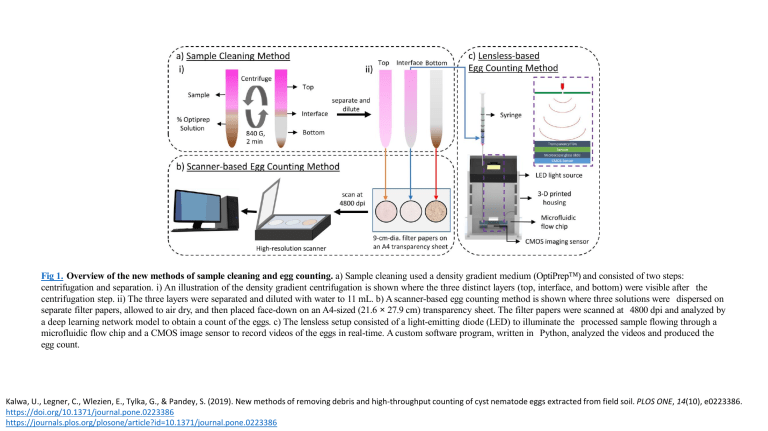
Fig 1. Overview of the new methods of sample cleaning and egg counting. a) Sample cleaning used a density gradient medium (OptiPrep™) and consisted of two steps: centrifugation and separation. i) An illustration of the density gradient centrifugation is shown where the three distinct layers (top, interface, and bottom) were visible after the centrifugation step. ii) The three layers were separated and diluted with water to 11 mL. b) A scanner-based egg counting method is shown where three solutions were dispersed on separate filter papers, allowed to air dry, and then placed face-down on an A4-sized (21.6 × 27.9 cm) transparency sheet. The filter papers were scanned at 4800 dpi and analyzed by a deep learning network model to obtain a count of the eggs. c) The lensless setup consisted of a light-emitting diode (LED) to illuminate the processed sample flowing through a microfluidic flow chip and a CMOS image sensor to record videos of the eggs in real-time. A custom software program, written in Python, analyzed the videos and produced the egg count. Kalwa, U., Legner, C., Wlezien, E., Tylka, G., & Pandey, S. (2019). New methods of removing debris and high-throughput counting of cyst nematode eggs extracted from field soil. PLOS ONE, 14(10), e0223386. https://doi.org/10.1371/journal.pone.0223386 https://journals.plos.org/plosone/article?id=10.1371/journal.pone.0223386 Fig 2. The convolutional autoencoder network model. Each box represents a three dimensional feature map (W, H, and D). The depth (D) of each box is mentioned on top and the x-y sizes (W, H) on the bottom. The blue box represents the feature map copied from the encoder step and is concatenated with the feature map (black box) generated by upsampling the previous layer. The input to the network is a 3-channel RGB image and the output is a 1-channel grayscale image. The arrows represent different operations. Kalwa, U., Legner, C., Wlezien, E., Tylka, G., & Pandey, S. (2019). New methods of removing debris and high-throughput counting of cyst nematode eggs extracted from field soil. PLOS ONE, 14(10), e0223386. https://doi.org/10.1371/journal.pone.0223386 https://journals.plos.org/plosone/article?id=10.1371/journal.pone.0223386 Fig 3. Wiring diagram for lensless imaging and design of the microfluidic flow chip. a) The CMOS sensor was connected to RPi through the CSI port. The 5V GPIO pin of RPi was connected to the anode of the LED while the ground pin from RPi was connected to the 60 Ω resistor. The cathode of the LED was connected to the other end of 60 Ω resistor. b) (i) An illustration of the microfluidic flow chip is shown. The microfluidic flow design was cut on a piece of double-sided tape using a cutting machine, and the tape was bonded to a microscope slide. A transparency film with input and output accesses was cut and adhered to the top side of the tape. Two circular tape pieces with holes cut in the center were attached to the fluid ports and placed around the access holes in the transparency sheet. (ii) A diagram of the assembled microfluidic flow chip is shown with all of the layers bonded together. Scale bar = 20 mm. Kalwa, U., Legner, C., Wlezien, E., Tylka, G., & Pandey, S. (2019). New methods of removing debris and high-throughput counting of cyst nematode eggs extracted from field soil. PLOS ONE, 14(10), e0223386. https://doi.org/10.1371/journal.pone.0223386 https://journals.plos.org/plosone/article?id=10.1371/journal.pone.0223386 Fig 4. The algorithm for the lensless SCN egg counting method is depicted as a flow chart. Kalwa, U., Legner, C., Wlezien, E., Tylka, G., & Pandey, S. (2019). New methods of removing debris and high-throughput counting of cyst nematode eggs extracted from field soil. PLOS ONE, 14(10), e0223386. https://doi.org/10.1371/journal.pone.0223386 https://journals.plos.org/plosone/article?id=10.1371/journal.pone.0223386 Fig 5. Distribution of debris in the OptiPrep™ solution before and after centrifugation. (i., ii.) Cropped images of the centrifuge tube before and after centrifugation. iii.) The mean pixel intensity of the samples in the centrifuge tube as a function of vertical distance (in mm) was plotted for before (orange) and after (purple) centrifugation. The different OptiPrep™ solutions used were 0%, 20%, 40%, 50%, 60%, and 80% by volume. The control (i.e. 0% OptiPrep™) does not have an interface layer, and so the supernatant is treated as the top and the pellet as the bottom layer. All test tubes pictured were 15 mL tubes. Kalwa, U., Legner, C., Wlezien, E., Tylka, G., & Pandey, S. (2019). New methods of removing debris and high-throughput counting of cyst nematode eggs extracted from field soil. PLOS ONE, 14(10), e0223386. https://doi.org/10.1371/journal.pone.0223386 https://journals.plos.org/plosone/article?id=10.1371/journal.pone.0223386 Fig 6. Software program to automatically detect SCN eggs among the debris in the scanner-based method. The software program starts with the full image of the filter paper and partitions it into patch images and sub-patches to identify and count the SCN eggs. a) An example of identifying eggs in a debris-laden, uncleaned sample is shown. b) An example of identifying eggs in an OptiPrep™ cleaned sample is shown where it is even possible to differentiate between stained eggs and juvenile nematodes which have recently emerged from the eggs. Scale bar = 15 mm. Kalwa, U., Legner, C., Wlezien, E., Tylka, G., & Pandey, S. (2019). New methods of removing debris and high-throughput counting of cyst nematode eggs extracted from field soil. PLOS ONE, 14(10), e0223386. https://doi.org/10.1371/journal.pone.0223386 https://journals.plos.org/plosone/article?id=10.1371/journal.pone.0223386 Fig 7. Sample cleaning using OptiPrep™ and SCN egg recovery from the three layers. a) The graph shows the ratio of SCN eggs recovered from the three layers (top, interface, and bottom layers) at different concentrations (volume percentages) of OptiPrep™. At 50% and higher OptiPrep™ concentrations, the egg recovery ratio was greater than 80% in the interface layer. b) The egg recovery percentage in the interface layer is listed for different percentages of OptiPrep™ by volume for four separate runs of processed samples. c) Raster plots help to visualize the spatial distribution of the eggs on the filter papers (corresponding to the interface layer) across four extraction runs as the volume percentage of OptiPrep™ was varied. The egg count for each patch image is denoted as a dark pixel in the raster plot. Kalwa, U., Legner, C., Wlezien, E., Tylka, G., & Pandey, S. (2019). New methods of removing debris and high-throughput counting of cyst nematode eggs extracted from field soil. PLOS ONE, 14(10), e0223386. https://doi.org/10.1371/journal.pone.0223386 https://journals.plos.org/plosone/article?id=10.1371/journal.pone.0223386 Fig 8. Comparison of the sample cleaning and SCN egg counting methods. a) i-iii) Steps performed to extract cysts, then eggs from cysts, stain eggs, perform sample cleaning (OptiPrep™ and sucrose cleaning methods), and egg counting (manual, scanner-based, and lensless imaging). b) The table lists the average egg count (n = 5) and standard deviation for the egg count from scanner-based and lensless methods compared to the standard nematode slide count on the uncleaned bulk sample. Kalwa, U., Legner, C., Wlezien, E., Tylka, G., & Pandey, S. (2019). New methods of removing debris and high-throughput counting of cyst nematode eggs extracted from field soil. PLOS ONE, 14(10), e0223386. https://doi.org/10.1371/journal.pone.0223386 https://journals.plos.org/plosone/article?id=10.1371/journal.pone.0223386 Fig 9. Reconstruction of the holographic videos and a time-lapsed visualization of the lensless imaging method. a) i) The raw image of a sample area was recorded by the lensless imaging setup (z = 8 mm). ii) The reconstructed image was produced using the Fresnel diffraction method. iii) The sample area was imaged with a stereo microscope with bright-field illumination at 50× magnification. Scale bar = 100 μm. b) The images were taken from a representative holographic video recorded by the lensless imaging setup and reconstructed thereafter. A small area of the flow channel is shown here. The eggs detected by the software were labeled with a distinct egg number. Scale bar = 200 μm. Kalwa, U., Legner, C., Wlezien, E., Tylka, G., & Pandey, S. (2019). New methods of removing debris and high-throughput counting of cyst nematode eggs extracted from field soil. PLOS ONE, 14(10), e0223386. https://doi.org/10.1371/journal.pone.0223386 https://journals.plos.org/plosone/article?id=10.1371/journal.pone.0223386 Fig 10. Performance of the software programs for automated SCN egg counting. a) The plot shows the SCN egg counts obtained for the three layers (top, interface, and bottom) for all different OptiPrep™ concentrations. The data points circled in orange belong to samples with fewer eggs. Similarly, the points circled in blue belong to samples with a large number of eggs. b) The plot shows the correlation between manual and software egg counts for all image patches of the three layers at 50% OptiPrep™ by volume. The data were collected from three filter papers, each subdivided into 324 patch images. c) The egg counts obtained from the two methods are compared: software program for lensless imaging method and the scanner-based egg counting method. Each processed sample was passed through the lensless imaging setup and further analyzed by the scanner-based method. There is high correlation between the egg counts from the two methods. The plotted data corresponds to 12 different processed samples. Kalwa, U., Legner, C., Wlezien, E., Tylka, G., & Pandey, S. (2019). New methods of removing debris and high-throughput counting of cyst nematode eggs extracted from field soil. PLOS ONE, 14(10), e0223386. https://doi.org/10.1371/journal.pone.0223386 https://journals.plos.org/plosone/article?id=10.1371/journal.pone.0223386

