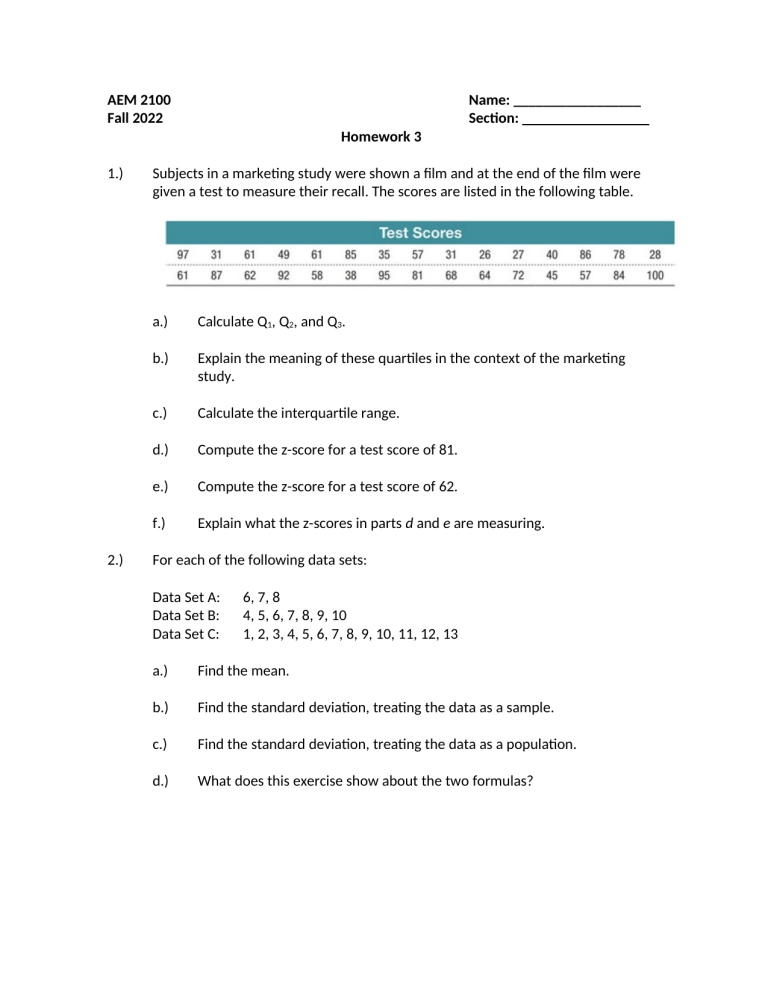
AEM 2100 Fall 2022 Name: _________________ Section: Homework 3 1.) 2.) Subjects in a marketing study were shown a film and at the end of the film were given a test to measure their recall. The scores are listed in the following table. a.) Calculate Q1, Q2, and Q3. b.) Explain the meaning of these quartiles in the context of the marketing study. c.) Calculate the interquartile range. d.) Compute the z-score for a test score of 81. e.) Compute the z-score for a test score of 62. f.) Explain what the z-scores in parts d and e are measuring. For each of the following data sets: Data Set A: Data Set B: Data Set C: 6, 7, 8 4, 5, 6, 7, 8, 9, 10 1, 2, 3, 4, 5, 6, 7, 8, 9, 10, 11, 12, 13 a.) Find the mean. b.) Find the standard deviation, treating the data as a sample. c.) Find the standard deviation, treating the data as a population. d.) What does this exercise show about the two formulas? 2 3.) A statistics student scored a 75 on the first exam of the semester and an 82 on the second exam of the semester. The average score and standard deviation of scores for the two exams are given in the following table. On which exam did the student perform relatively better? Justify your answer quantitatively. 4.) Although the standard workweek is 40 hours a week, many people work a lot more than 40 hours a week. The following data give the numbers of hours worked last week by 50 people. Note that the data is in order, row by row. 40.5 43.7 47.8 50.8 54.4 a.) 5.) 41.3 43.9 48.2 51.5 54.8 41.4 45.0 48.3 51.5 55.0 41.5 45.0 48.8 52.3 55.4 42.0 45.2 49.0 52.3 55.4 42.2 45.8 49.2 52.6 55.4 42.4 45.9 49.9 52.7 56.2 42.4 46.2 50.1 52.7 56.3 42.6 47.2 50.6 53.4 57.8 43.3 47.5 50.6 53.9 58.7 Using Chebyshev's theorem, calculate the intervals that contain at least 75%, 89%, and 93.75% of the data. b.) Determine the actual percentages of the given data values that fall in each of the intervals that you calculated in part a. c.) Do you think the lower endpoints of the intervals provided by Chebyshev's theorem in part a are useful for this data? Explain your answer. d.) Suppose that the individual with the first number (54.4) in the fifth row of the data is a workaholic who actually worked 84.4 hours last week and not 54.4 hours. With this change, the summary statistics are now X = 49.61 hours and s = 7.10 hours. Recalculate the intervals for part a and the actual percentages for part b. Did your percentages change a lot or a little? Please give a reasoning for your response. The waiting times for patients at a walk-in clinic have a skewed distribution with a mean of 30 minutes and a standard deviation of 6 minutes. a.) What is the minimum percentage of patients at this walk-in clinic who will have to wait 15 to 45 minutes? 3 6.) 7.) b.) What is the minimum percentage of patients at this walk-in clinic who will have to wait 12 to 48 minutes? c.) Find the interval that contains waiting times of at least 75% of the patients. The manager of a local diner has calculated his average daily sales to be $4500 with a standard deviation of $750. a.) In what range can the manager expect his daily sales to be 68% of the time? b.) In what range can the manager expect his daily sales to be 95% of the time? c.) In what range can the manager expect his daily sales to be 99.7% of the time? d.) What assumption did you make about daily sales when answering parts a, b, and c? The test scores for a large statistics class have a bell-shaped distribution with a mean of 70 points. a.) If 16% of all students in the class scored above 85, what is the standard deviation of the scores? b.) If 95% of the scores are between 60 and 80, what is the standard deviation? Extra Practice: You do not need to hand in these problems. They are only included in case you want additional practice in the concepts. 8.) From your textbook, page 128 #29. 9.) From your textbook, page 135 #39. 10.) From your textbook, page 136 #41.


