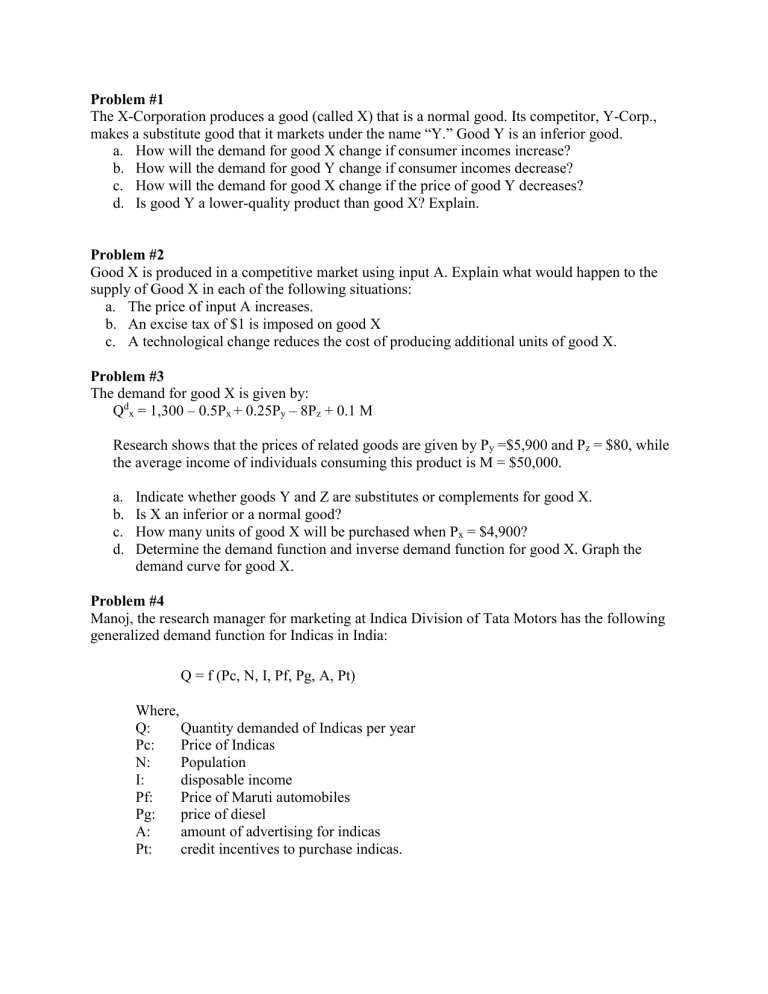
Problem #1 The X-Corporation produces a good (called X) that is a normal good. Its competitor, Y-Corp., makes a substitute good that it markets under the name “Y.” Good Y is an inferior good. a. How will the demand for good X change if consumer incomes increase? b. How will the demand for good Y change if consumer incomes decrease? c. How will the demand for good X change if the price of good Y decreases? d. Is good Y a lower-quality product than good X? Explain. Problem #2 Good X is produced in a competitive market using input A. Explain what would happen to the supply of Good X in each of the following situations: a. The price of input A increases. b. An excise tax of $1 is imposed on good X c. A technological change reduces the cost of producing additional units of good X. Problem #3 The demand for good X is given by: Qdx = 1,300 – 0.5Px + 0.25Py – 8Pz + 0.1 M Research shows that the prices of related goods are given by Py =$5,900 and Pz = $80, while the average income of individuals consuming this product is M = $50,000. a. b. c. d. Indicate whether goods Y and Z are substitutes or complements for good X. Is X an inferior or a normal good? How many units of good X will be purchased when Px = $4,900? Determine the demand function and inverse demand function for good X. Graph the demand curve for good X. Problem #4 Manoj, the research manager for marketing at Indica Division of Tata Motors has the following generalized demand function for Indicas in India: Q = f (Pc, N, I, Pf, Pg, A, Pt) Where, Q: Quantity demanded of Indicas per year Pc: Price of Indicas N: Population I: disposable income Pf: Price of Maruti automobiles Pg: price of diesel A: amount of advertising for indicas Pt: credit incentives to purchase indicas. Indicate whether you would expect each independent variable to be directly or inversely related to the quantity demanded of Indicas and the reason for the same. Problem #5 Suppose that Tata’s consultant estimated the following regression equation for Indica automobiles: Q = 1,00,000 – 100Pt +2000N +50I + 30 Pm – 1000Pp +3A +40,000Pi Where, Q: Quantity demanded per year of Indica automobiles Pt: price of Indica automobiles (in dollars) N: I: Pm: Pp: A: Pi: population of India (in millions) per capita disposable income (in dollars) price of Maruti automobiles (in dollars) real price of petrol (in cents per gallon) advertising expenditure by Indica (in dollars per year) credit incentives to purchase Indicas (in percentages) a. Indicate the change in the number of Indicas purchased per year for each unit change in independent variable. b. Find the value of Q if average value of Pt = $9000, N= 200 million, I = $10,000, Pm= $8,000, Pp = 80 cents, A = $20,00,000 and id Pt = 1. c. Derive the equation for the demand curve for Indicas d. Plot it. Problem #6 The following is a demand schedule for cheeseburgers for an individual. PRICE OF CHEESEBURGERS QUANTITY DEMANDED 5.00 0 4.50 1 4.00 2 3.50 3 3.00 4 2.50 5 2.00 6 1.50 7 1.00 8 0.50 9 a. Plot the demand curve for cheeseburgers, with price on the Y-axis, and quantity demanded per week on the X-axis. b. Assuming chicken and cheeseburgers are perfect substitutes, and income is fixed at £24, what is likely to happen to the demand for chicken burgers (to the nearest burger) if the price of cheeseburgers rises to £4.00? Problem #7 Determine whether the following goods are substitutes, complements or not related. a. Public and private transportation b. Coke and Pepsi c. Alarm clocks and automobiles d. Golf clubs and gold balls Problem #8 How will the following affect demand curve for DVD players? a. An increase in price of DVD players. b. An increase in price of film DVDs c. An increase in per capita income d. A decrease in price of cinema tickets


