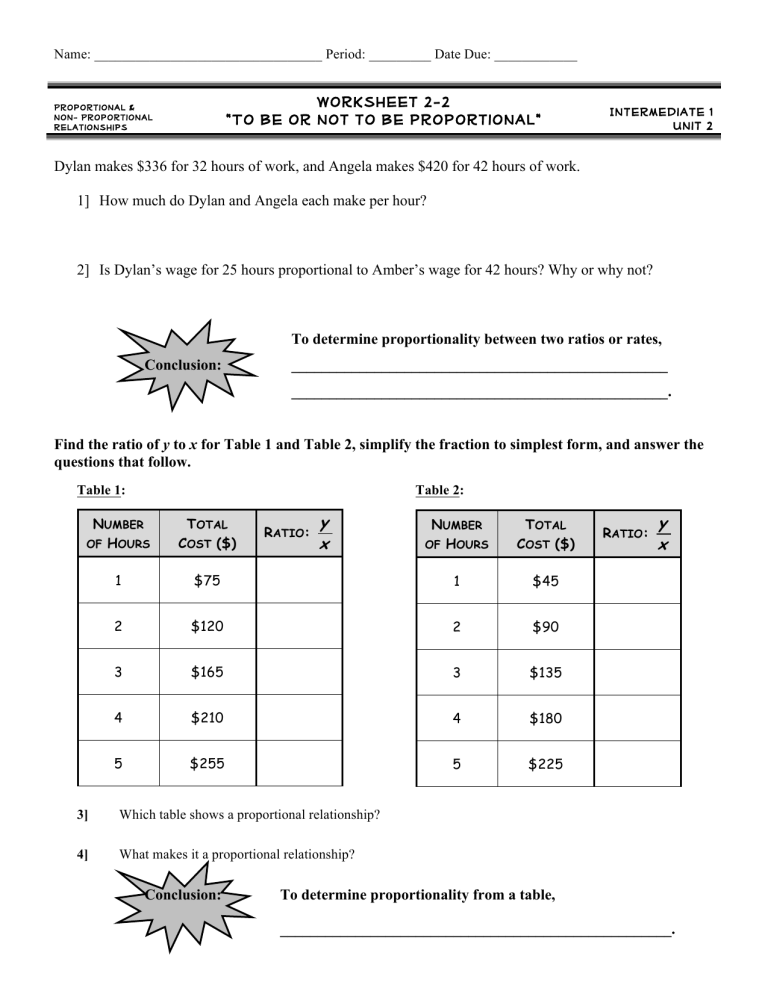
Name: _________________________________ Period: _________ Date Due: ____________ Worksheet 2-2 “To be or not to be proportional” Proportional & non- Proportional relationships Intermediate 1 Unit 2 Dylan makes $336 for 32 hours of work, and Angela makes $420 for 42 hours of work. 1] How much do Dylan and Angela each make per hour? 2] Is Dylan’s wage for 25 hours proportional to Amber’s wage for 42 hours? Why or why not? To determine proportionality between two ratios or rates, Conclusion: __________________________________________________ __________________________________________________. Find the ratio of y to x for Table 1 and Table 2, simplify the fraction to simplest form, and answer the questions that follow. Table 1: Table 2: NUMBER OF HOURS TOTAL COST ($) 1 y x NUMBER OF HOURS TOTAL COST ($) $75 1 $45 2 $120 2 $90 3 $165 3 $135 4 $210 4 $180 5 $255 5 $225 RATIO: 3] Which table shows a proportional relationship? 4] What makes it a proportional relationship? Conclusion: RATIO: y x To determine proportionality from a table, ____________________________________________________. Below are the graphs for the tables in the previous section. Use the graphs to determine proportionality. Table 2: 300 300 270 270 240 240 210 210 180 180 Total Cost ($) Total Cost ($) Table 1: 150 120 150 120 90 90 60 60 30 30 0 2 4 6 8 10 12 14 0 2 4 Number of Hours 6 8 10 12 14 Number of Hours 5] Which graph shows a proportional relationship? 6] What makes it a proportional relationship? To determine proportionality from a graph, ________________________________________________________ Conclusion: _______________________________________________________ _______________________________________________________. Determine which of the following tables represent proportional relationships. 1) x y x y x y 1 −3 −4 −8 −1 2 −6 −2 −4 3 −9 0 4 −12 5 −15 8) x y −6 −1 −1.5 0 −5 1 1.5 0 1 −3 3 4.5 2 4 2 0 5 7.5 4 8 3 4 7 10.5 9) 10) Determine which of the following graphs represent proportional relationships. Circle the appropriate response. 11. 12. Proportional non-proportional 14. 13. Proportional non-proportional 15. Proportional non-proportional 16. • • • Proportional non-proportional Proportional non-proportional Proportional 17. Is the following relationship proportional? Explain. Number of Movie Tickets (x) Total Cost of Tickets (y) 1 -6 2 -12 3 -18 4 -24 y x 18. How is a proportional relationship different from a non-proportional relationship? non-proportional
