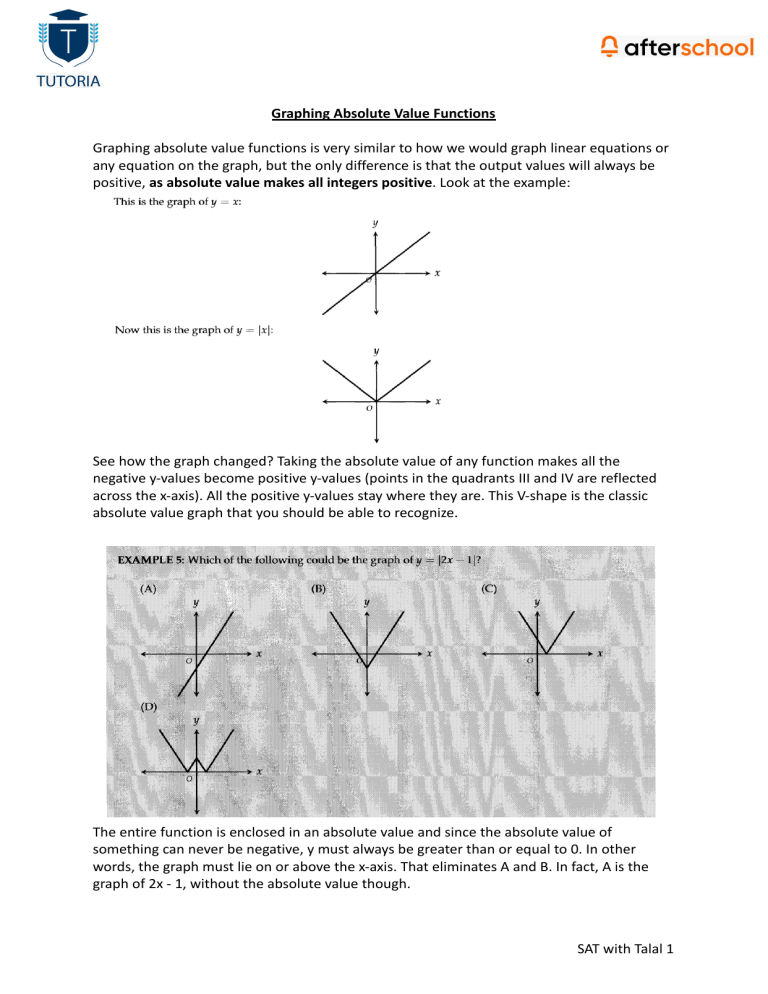
Graphing Absolute Value Functions Graphing absolute value functions is very similar to how we would graph linear equations or any equation on the graph, but the only difference is that the output values will always be positive, as absolute value makes all integers positive. Look at the example: See how the graph changed? Taking the absolute value of any function makes all the negative y-values become positive y-values (points in the quadrants III and IV are reflected across the x-axis). All the positive y-values stay where they are. This V-shape is the classic absolute value graph that you should be able to recognize. The entire function is enclosed in an absolute value and since the absolute value of something can never be negative, y must always be greater than or equal to 0. In other words, the graph must lie on or above the x-axis. That eliminates A and B. In fact, A is the graph of 2x - 1, without the absolute value though. SAT with Talal 1 To get the answer, we take all the points with negative y-values in the graph of A and reflect them across the x axis so that they are positive. The graph we end up getting is C. One great tactic that I recommend you use to narrow down the answer choices is by obtaining points that are easy to calculate. For example, if we let x = 0, then y = |2(0) - 1|. The point (0,1) must then be on the graph, eliminating A and B. Letting y = 0, we now find that (0.5, 0) must also be on the graph. This eliminates D because D has 2 x-intercepts, whereas the graph should only have 1. The same rules of transformations apply to graphs of absolute values. Following at graphical representations of these transformations when carried out on absolute function graphs. Remember that f(x) + or - c will be a vertical shift, whereas f(x+ or - c) will be a horizontal shift. These transformations are most commonly tested on the SAT, so make sure you remember them! SAT with Talal 2 If x is an integer, how many possible values for x are there that satisfy the inequality |2-x|<-5 (A) Zero (B) Eight (C) Nine (D) Eleven Correct Answer: A SAT with Talal 3 By the definition of absolute value, ∣2−x∣ is nonnegative. Hence, it cannot be less than -5, and there is no solution. Let’s go over why the other answer choices are wrong. Tip: Read the entire question carefully. Tip: If you can, verify your choice. (B) If you solve for all the integers x that satisfy the inequality [2−x∣<5, you will get x=x=-2, -1, 0, 1, 2, 3, 4, 5, and 6. If you then miscount, or if you think 0 is not an integer, you may get this wrong answer. The inequality in the prompt is actually |2−x∣<−5. You could verify your result. If x=1, |2-x| < -5 will become |2-1|< -5 which is false. Therefore, you should look for a mistake. (C) If you solve for all the integers x that satisfy the inequality ∣2−x∣<5, you will get x=-2, -1, 0, 1, 2, 3, 4, 5, and 6, or nine values for x. But, the inequality in the prompt is actually |2−x∣<−5. You could verify your result. If x=0, ∣2−x∣<−5 will become |2-0| < -5,∣2−0∣<−5, or 0 < -5,0<−5, which is false. You should look for a mistake. (D) If you solve for all the integers x that satisfy the inequality ∣2−x∣≤5, you will get x=-3, -2, -1, 0, 1, 2, 3, 4, 5, and 6, 7, or eleven values for x. But, the inequality in the prompt is actually ∣2−x∣<−5. You could verify your result. If x=0, ∣2−x∣<−5 will become |2-0|< -5, or 2<−5, which is false, and you should look for a mistake. SAT with Talal 4 Method 1: This is the quickest and, in my opinion, the easiest method to get to the answer of an absolute value graph question. The original function, y=x-4, may yield non-negative or negative outputs. y=|x-4| will not change the original function's non-negative outputs, but it will make all of its negative outputs positive. On a graph, this means that, when taking the absolute value of a function, all the values of the original function located below the x−axis (shaded in the graph above) reflect over the x−axis, as shown. The graph in choice (D) is the only one that matches this result. SAT with Talal 5 Method 2: Plug in values and graph the points Method 3: Eliminate all other answer choices SAT with Talal 6
