Uploaded by
Matthew Daddino
Low-Cost Scanning Fabry Perot Interferometer for Student Labs
advertisement

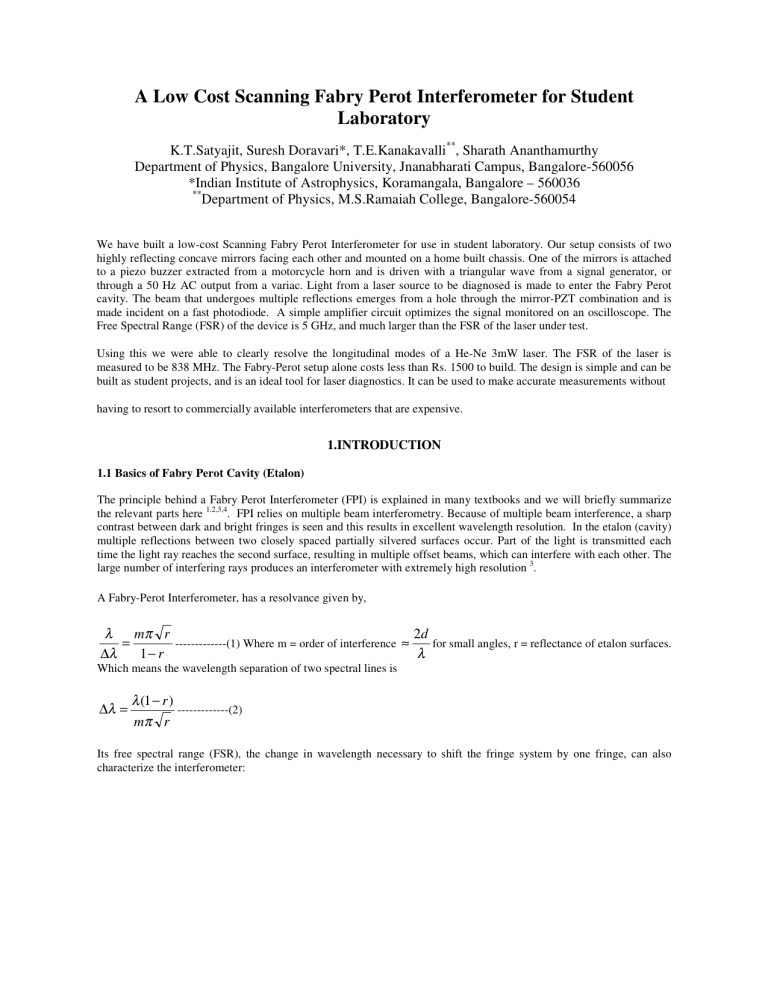
A Low Cost Scanning Fabry Perot Interferometer for Student Laboratory K.T.Satyajit, Suresh Doravari*, T.E.Kanakavalli**, Sharath Ananthamurthy Department of Physics, Bangalore University, Jnanabharati Campus, Bangalore-560056 *Indian Institute of Astrophysics, Koramangala, Bangalore – 560036 ** Department of Physics, M.S.Ramaiah College, Bangalore-560054 We have built a low-cost Scanning Fabry Perot Interferometer for use in student laboratory. Our setup consists of two highly reflecting concave mirrors facing each other and mounted on a home built chassis. One of the mirrors is attached to a piezo buzzer extracted from a motorcycle horn and is driven with a triangular wave from a signal generator, or through a 50 Hz AC output from a variac. Light from a laser source to be diagnosed is made to enter the Fabry Perot cavity. The beam that undergoes multiple reflections emerges from a hole through the mirror-PZT combination and is made incident on a fast photodiode. A simple amplifier circuit optimizes the signal monitored on an oscilloscope. The Free Spectral Range (FSR) of the device is 5 GHz, and much larger than the FSR of the laser under test. Using this we were able to clearly resolve the longitudinal modes of a He-Ne 3mW laser. The FSR of the laser is measured to be 838 MHz. The Fabry-Perot setup alone costs less than Rs. 1500 to build. The design is simple and can be built as student projects, and is an ideal tool for laser diagnostics. It can be used to make accurate measurements without having to resort to commercially available interferometers that are expensive. 1.INTRODUCTION 1.1 Basics of Fabry Perot Cavity (Etalon) The principle behind a Fabry Perot Interferometer (FPI) is explained in many textbooks and we will briefly summarize the relevant parts here 1,2,3,4. FPI relies on multiple beam interferometry. Because of multiple beam interference, a sharp contrast between dark and bright fringes is seen and this results in excellent wavelength resolution. In the etalon (cavity) multiple reflections between two closely spaced partially silvered surfaces occur. Part of the light is transmitted each time the light ray reaches the second surface, resulting in multiple offset beams, which can interfere with each other. The large number of interfering rays produces an interferometer with extremely high resolution 3. A Fabry-Perot Interferometer, has a resolvance given by, λ mπ r 2d -------------(1) Where m = order of interference ≈ for small angles, r = reflectance of etalon surfaces. = ∆λ 1− r λ Which means the wavelength separation of two spectral lines is ∆λ = λ (1 − r ) -------------(2) mπ r Its free spectral range (FSR), the change in wavelength necessary to shift the fringe system by one fringe, can also characterize the interferometer: ∆λ = λ2 -------------------(3) Where d is the separation between the mirrors. 2d Standing waves will be formed in the cavity when constructive interference between the incident and reflected waves occurs. Only those frequencies are allowed, such that the cavity length is an integral number of half wavelengths. If the cavity length is d 2d = n Where n is an integer λ nc And ν = 2d The frequency difference between adjacent longitudinal modes is ν q +1 − ν q = C -----------(4) 2d For say, q=1, this would be just the mode separation in terms of frequency, and when expressed in terms of wavelength, is the same as equation (2), which is the FSR. This shows that the length d is the only determining factor for the FSR. Another measure of the performance of an interferometer or laser cavity is the "finesse". This dimensionless quantity is the ratio of the FSR to the resolution. (Finesse = FSR/Resolvance). Using equation (2) Finesse = π r -----------(5) 1− r With a reflectivity of 99 percent for both mirrors, the finesse will be roughly 300. If the FSR is 10 GHz, the resolution will be approximately 33 MHz. 1.2 Scanning Fabry Perot Interferometer The FPI can be used as a scanning device in the following way: The axial position of one of the mirrors can be varied very slightly by a linear Piezo Transducer (PZT). Driving the PZT with a triangle waveform and watching the response of the photodiode on an oscilloscope can display the longitudinal modes of the laser under test (LUT) displayed in real time. In essence, the comb response of the SFPI is used as a tunable filter to analyse the finer detail of the optical spectrum of the LUT. As long as the FSR of the FPI is larger (i.e., smaller cavity length) than that of the LUT, the mode display will be unambiguous. Commercially available scanning FPIs are prohibitively expensive and may not be affordable by most of the university graduate laboratories. Students can build this low cost scanning Fabry Perot Interferometer (SFPI) as part of a project. The exercise can help the student gain a deeper understanding of the subtleties behind interferometric measurements and the workings of laser cavities. 1.3 Uses of FPI in Classrooms: 1.Illustrations of axial modes of a laser: The comb response of the SFPI can be used as a tunable filter to analyse the laser gain profile of the LUT. The condition for unambiguous resolution of the longitudinal modes of laser is that the FSR of the Fabry-Perot cavity be larger than the FSR of the LUT. From previous discussion it evident that the FSR is larger if the length of the cavity is smaller. A cavity length of 3 cm (FSR=5 GHz) is found to easily resolve the longitudinal modes of a laser of FSR of about 750 MHz. 2. Illustrations of shapes of the transverse modes generated in the SFPI cavity: The transverse modes arising within the external cavity can be displayed by projecting on a screen (in place of the photodiode). The TEM modes can be clearly visualized in this manner. 2.Apparatus and Experiment 2.1 The Setup The heart of a SFPI consists of two highly reflecting mirrors that are held parallel, with the reflecting surfaces facing each other. This forms a Fabry Perot cavity. The laser whose output is to be analyzed is made to enter this cavity along the axial direction. Figure (1) shows a schematic of the setup. Figure 1: Schematic of the setup. The mirrors were extracted from an old and non-working He Ne laser cavity. They have reflectivities of about 95% One of the mirrors (the front mirror m1) is kept fixed and the other (rear mirror m2) is fitted on a piezo electric transducer. Driving the PZT with an oscillating voltage modulates the rear mirror. A photodiode is placed behind the rear mirror in the axial direction for detection. The whole setup is mounted on a home built steel chassis. Two plates are fixed facing each other vertically on the base. The front mirror is held using a lens holder, which is threaded onto a steel disc. The PZT extracted from a motorcycle horn comprises of a thin layer of the Piezo material, stuck on one side of a circular brass plate. The rear mirror is glued to the free surface of the brass disc. The PZT with a spacer in between is held fitted to another steel disc. Both steel discs are fitted onto the plates by three adjustable screws. Figure (2) shows a magnified view of the PZT mount. Figure 2: Diagram showing the PZT and Mount This PZT- mirror unit is made to rest on a steel disc, such that the PZT sits into a circular step cut in the steel disc. A spacer is provided to electrically isolate the PZT and the steel disc. The brass plate holding the PZT is clamped onto the disc at the periphery by a steel ring, with the help of screws. Voltage is applied between two faces of the PZT (Brass disc forms one terminal and a wire soldered on the PZT forms the other terminal). This makes the brass disc to flex, causing the mirror to move axially.A hole drilled on the PZT and the steel disc, allows light to exit through the PZT-mirror combination, before being incident on the photodiode or the screen. 2.2 Alignment of SFPI: A translucent screen is placed behind the SFPI. For preliminary alignment, the front mirror is removed and light from the laser source is made to fall on the rear mirror. The screws are adjusted till the laser beam reflects back close to the source. The reflected beam is steered off axis slightly in order to avoid undesirable fringe patterns appearing because of the laser aperture and other reflections. This ensures normal incidence on the rear mirror. Now the front mirror is repositioned. The three adjustable screws on the both the mirrors are moved synchronously to walk the beam. The merging of the two spots on the screen indicated good alignment, and it results in the appearance of fringes of circular symmetry. Transverse modes formed because of the SFPI cavity, are seen on the screen. By applying a DC and varying it slowly, we can move between the various transverse modes. The DC is adjusted such that the fundamental Gaussian mode is seen. This makes further alignment easier once the screen is replaced by the photodiode. The output from the SFPI is made incident on the photodiode connected to a low noise operational amplifier circuit. The amplified voltage is fed into one channel of an oscilloscope, while the other channel monitors the input voltage to the PZT. The PZT is driven with a Variac in series with a DC from a power supply. (DC = 10 volts, AC = 20 volts.) A Hamamatsu S2386-44K photodiode was used to detect the light. We summarize below, the data including input parameters of the SFPI: Mirror: from discarded 5 mW He-Ne laser tubes (ECIL) Cavity type: Spherical Mirror reflectivity (r): 95 percent. Mirror radius of curvature (RoC): 1m. Mirror mounts: Three point adjustable. Distance between mirrors (d): Approximately 3 cm (FSR of 5 GHz). Transverse mode filter (of the SFPI cavity): 1mm radius pinhole aperture. Photo detector: Hamamatsu S2386-44K ICs used in Op-amp circuits: OP07 and OP27. PZT: Motorcycle horn (manufacturer unknown). Laser Under Test: Melles Griot (05-LHR-121) Driving source: Variac (variable AC voltage, at 50 HZ) in series with a constant DC (Aplabs LD3202) Display: Tektronix TDS220 oscilloscope. 3.Results and Discussion The mode structure is obtained by scanning and the results are shown in figure (3). Figure 3: Oscilloscope trace revealing the mode structure of the LUT. While the tall peaks are that of the longitudinal modes the short peaks are due to the transverse modes either from the laser or the external cavity. 3.1 Longitudinal Modes The oscilloscope trace shows two scans of the laser spectrum. The distance between similar peaks (about 1.730ms on the time axis) is the FSR of the SFPI. This corresponds to about 5.0 GHz (=c/2L, where L=3cm is the distance between the SFPI mirrors). Therefore the distance between the longitudinal modes of the LUT (about 0.290ms on the time axis) is 838 MHz (=0.290* 5 GHz / 1.730) and is the FSR of the LUT. This corresponds to a laser cavity length of 18cm. Further we observe that introducing a polarizer between the LUT and SFPI modulates the heights of the peaks alternating, thereby confirming the mutually orthogonal linear polarization of the longitudinal modes of the laser. This feature is also stated in the laser manual. We observe that there are only two such modes of the given laser, and this is in agreement with the allowed number given the gain profile of the laser 5. The (time scale) distance between the repeated peak pattern on the scope depends on the speed of scanning. However, the ratio of separation of consecutive tall peaks to the distance between the adjacent peaks of a given order is the same provided the response of the PZT is linear. The PZT is ideally driven with a triangular wave from a function generator, since the triangular waveform is linear. But the PZT throw was not sufficient in our case (not enough to cover more than one order of the laser spectrum), as the function generator we used delivered maximum amplitude of only 10 volts. The PZT we used had a single layer unlike the commercially available ones, which are stacked, and have a larger throw. We were able to solve this problem by using a variac at 50 Hz, which can deliver upto 240 volts. The non-linearity of the sine wave output was initially an issue. However at increased input amplitudes the portion of the curve at which the modes are seen is approximately linear 4. With peak-to-peak voltages upto 40 volts we could clearly resolve the longitudinal modes, by scanning two orders of the spectrum. The longitudinal mode spacing on the display reduced with increase in the amplitude as other orders were accommodated. We used a constant DC of around 10 volts in series with the varaic, which improved the throw. This is because the PZT was observed to have better throw in a flexed state. The mode structure seemed to stabilize within an hour or two after the laser was switched on. During the first hour no symmetrical mode structure was observed but this appeared later. The appearance of such symmetrical mode structures can be a criterion for checking the laser stabilization, in experiments. 3.2 Transverse mode control: The transverse modes that can be visualized on a screen originate from the SFPI cavity. These are undesirable while observing the longitudinal mode structure of the laser. An aperture inside the SFPI cavity helps reduce the transverse modes. We used an iris inside the SFPI cavity initially and the transverse modes almost disappeared when the aperture size was reduced to a radius of 1mm. However further reducing the aperture resulted in a considerable attenuation of the longitudinal modes, indicating the residual transverse modes could be originating in the LUT. An aperture with a 1mm radius was later fixed inside the cavity. This is detachable when cavity alignment is needed or when the mode structure of the SFPI cavity modes needs to be visualized. 3.3 Visualization of transverse modes The visualization of the transverse modes was effective and we could clearly make out the TEM00, TEM10, TEM330, TEM11, TEM21, TEM43 modes. Further, when the cavity was well aligned we could see circularly symmetric modes. After the initial alignment further fine-tuning is possible by applying DC alone and observing the transverse modes. Alignment is carried out until the modes attain circular symmetry. At this point the contrast in the intensity distribution increases which results in an increase in the amplitude of the longitudinal mode peak. 4. Conclusion In conclusion, we have built a low-cost scanning Fabry-Perot Interferometer device that can be used to resolve the longitudinal mode structure of a He-Ne laser. The device is simple to build and can be part of a short-term student project in a course in photonics. Using this, we were able to resolve the two longitudinal modes of a 3mW Melles Griot He-Ne laser and determined the FSR of the laser to be 838MHz. We have also used the SFPI to visualize the transverse modes generated within its cavity. Acknowledgement One of the authors (S.A) acknowledges a research grant from the Board of Research in Nuclear Sciences (DAE). References 1. 2. 3. 4. A.C.Mellissinos and J.Napolitano, Experiments in Modern Physics, Academic Press, 2003. A.Ghatak and K.Thyagarajan, Optical Electronics, Cambridge University Press, 2004. William L.Wolfe, Introduction to Imaging Spectrometers, SPIE, Washington, 1997. A simple Scanning Spherical Mirror Fabry-Perot Interferometer, L. Pandit and D.D.Bhavalkar, Indian.J.Pure Appl.Phy, 10, 487 (1972). 5. William T.Silfvast, Laser Fundamentals, Cambridge University Press, New Delhi, 1998.


