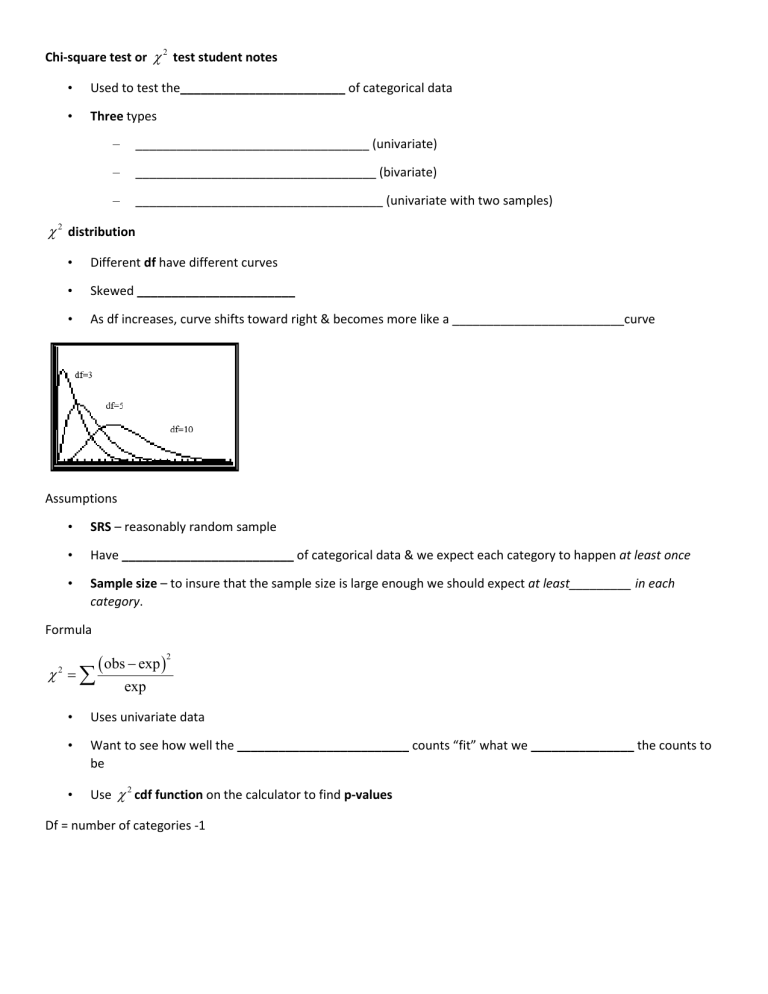
Chi-square test or χ 2 test student notes • Used to test the________________________ of categorical data • Three types – __________________________________ (univariate) – ___________________________________ (bivariate) – ____________________________________ (univariate with two samples) χ 2 distribution • Different df have different curves • Skewed _______________________ • As df increases, curve shifts toward right & becomes more like a _________________________curve Assumptions • SRS – reasonably random sample • Have _________________________ of categorical data & we expect each category to happen at least once • Sample size – to insure that the sample size is large enough we should expect at least_________ in each category. Formula χ =∑ 2 ( obs − exp ) 2 exp • Uses univariate data • Want to see how well the _________________________ counts “fit” what we _______________ the counts to be • Use χ 2 cdf function on the calculator to find p-values Df = number of categories -1 χ 2 Goodness of fit test • Uses univariate data • Want to see how well the _____________________counts “fit” what we ______________ the counts to be Hypotheses – written in words H0: proportions are ________________ Ha: at least ____________________ proportion is not the same Be sure to write in context! Does your zodiac sign determine how successful you will be? Fortune magazine collected the zodiac signs of 256 heads of the largest 400 companies. Is there sufficient evidence to claim that successful people are more likely to be born under some signs than others? How many would you expect in each sign if there were no difference between them? How many degrees of freedom? χ 2 test for independence • Used with categorical, bivariate data from________________ sample • Used to see if the two categorical variables are associated (_____________________) or not associated (___________________________) Hypotheses – written in words H0: two variables are independent Ha: two variables are__________________________ Be sure to write in context! A beef distributor wishes to determine whether there is a relationship between geographic region and cut of meat preferred. If there is no relationship, we will say that beef preference is independent of geographic region. Suppose that, in a random sample of 500 customers, 300 are from the North and 200 from the South. Also, 150 prefer cut A, 275 prefer cut B, and 75 prefer cut C. If beef preference is independent of geographic region, how would we expect this table to be filled in? North South Total Cut A 150 Cut B 275 Cut C 75 Total 300 200 500 Now suppose that in the actual sample of 500 consumers the observed numbers were as follows: North South Total Cut A 100 50 150 Cut B 150 125 275 Cut C 50 25 75 Total 300 200 500 Is there sufficient evidence to suggest that geographic regions and beef preference are not independent? (Is there a difference between the expected and observed counts?) χ 2 test for homogeneity • Used with a single categorical variable from ____________ (or more) independent samples • Used to see if the two populations are the same (____________________________) • Assumptions & formula remain the same! • Expected counts & df are found the same way as test for independence. • Only change is the ____________________________! Hypotheses – written in words H0: the proportions for the two (or more) distributions are the ___________________________ Ha: At least one of the proportions for the distributions is _________________________________ Be sure to write in context! The following data is on drinking behavior for independently chosen random samples of male and female students. Does there appear to be a gender difference with respect to drinking behavior? (Note: low = 1-7 drinks/wk, moderate = 8-24 drinks/wk, high = 25 or more drinks/wk) The following data is on drinking behavior for independently chosen random samples of male and female students. Does there appear to be a gender difference with respect to drinking behavior? (Note: low = 1-7 drinks/wk, moderate = 8-24 drinks/wk, high = 25 or more drinks/wk) Men Women Total None 140 186 326 Low 478 661 1139 Moderate 300 173 473 High 63 16 79 Total 981 1036 2017 Suppose, in a random sample of 75 peanut M&M’s, you get the distribution of colors as shown below. Is the distribution of peanut M&M’s different from the distribution of plain M&M’s? The distribution for plain M&M’s is 13% red, 14% yellow, 16% green, 20% orange, 13% brown, and 24% blue. Color a. Red 11 Yellow 16 Green 8 Orange 5 Brown 17 Blue 18 Identify if goodness of fit, test for independence, or Test of Homogeneity b. null and alternative hypothesis c. Number of M&M’s χ2 value and p-value d. interpret the p-value Here is a table showing who survived the sinking of the Titanic based on whether they were crew members, or passengers booked in first-, second-, or third-class staterooms. Crew First Second Third Total Alive 212 202 118 178 710 Dead 673 123 167 528 1491 Total 885 325 285 706 2201 Is there an association between survival and type of passenger on the Titanic? a. Identify if goodness of fit, test for independence, or Test of Homogeneity b. null and alternative hypothesis c. χ2 value and p-value d. interpret the p-value A researcher wants to determine if the number of minutes spent watching television per day is independent of gender. A random sample of 315 adults was selected and the results are shown below. Is there enough evidence to conclude that the number of minutes spent watching television per day is related to gender? a. Identify if goodness of fit, test for independence, or Test of Homogeneity b. null and alternative hypothesis c. χ2 value and p-value d. interpret the p-value


