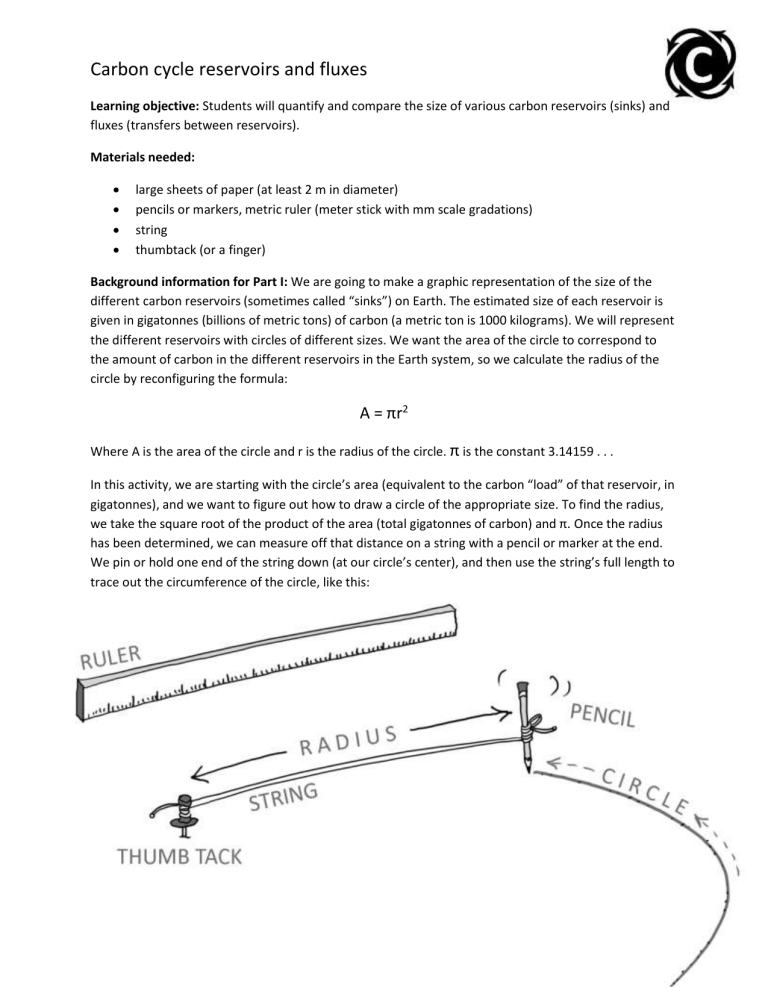
Carbon cycle reservoirs and fluxes Learning objective: Students will quantify and compare the size of various carbon reservoirs (sinks) and fluxes (transfers between reservoirs). Materials needed: large sheets of paper (at least 2 m in diameter) pencils or markers, metric ruler (meter stick with mm scale gradations) string thumbtack (or a finger) Background information for Part I: We are going to make a graphic representation of the size of the different carbon reservoirs (sometimes called “sinks”) on Earth. The estimated size of each reservoir is given in gigatonnes (billions of metric tons) of carbon (a metric ton is 1000 kilograms). We will represent the different reservoirs with circles of different sizes. We want the area of the circle to correspond to the amount of carbon in the different reservoirs in the Earth system, so we calculate the radius of the circle by reconfiguring the formula: A = πr2 Where A is the area of the circle and r is the radius of the circle. π is the constant 3.14159 . . . In this activity, we are starting with the circle’s area (equivalent to the carbon “load” of that reservoir, in gigatonnes), and we want to figure out how to draw a circle of the appropriate size. To find the radius, we take the square root of the product of the area (total gigatonnes of carbon) and π. Once the radius has been determined, we can measure off that distance on a string with a pencil or marker at the end. We pin or hold one end of the string down (at our circle’s center), and then use the string’s full length to trace out the circumference of the circle, like this: Reservoir Area of circle (each mm2 equivalent to 2 gigatonnes of carbon) Radius of circle (mm) Atmosphere 426 11.6 Vegetation + soils 1,900 24.6 Fossil fuels still unburned 2,150 26.2 Oceans 19,000 77.8 Crust 2,850,000 952.5 Mantle 5,000,000 1261.6 (Data source: Ralph Keeling, Scripps Institution of Oceanography) Converting metric distances: 1000 mm = 100 cm = 1 m Using the materials in your classroom, you should create six circles, one for each of the major reservoirs of carbon. Each circle should have a radius matching the number in the final column above. Label each circle with the name of the reservoir it represents. Alternative: If it is a nice day, go outside with chalk and draw the circles on a big plot of sidewalk. Discussion: 1. Which of Earth’s carbon reservoirs is the smallest? Does this “smallest” rank indicate it is therefore unimportant? Explain. Atmosphere – it is less than half the size of the next smallest reservoir, vegetation and soils. No, the fact that it is small does not mean it is unimportant. A very small Ebola virus particle would not be seen as unimportant in one’s bloodstream. A tiny bit of iodine is needed to keep our thyroid from developing goiter. Small does not equate to unimportant. 2. How much larger would the “atmosphere” carbon reservoir grow if the entire “fossil fuel” reservoir were mined and then burned? It would be much bigger: 422 mm2 + 2156 mm2 = 2578 mm2. That is 6.1 times as large as the current atmospheric carbon load. Another way of putting this is that the post-total-fossil-fuelcombustion atmosphere would have 610% the carbon of the current atmosphere. This assumes, of course that all the fossil fuel carbon stays put in the atmosphere, which is of course unrealistic. Some will diffuse into the oceans. Some will be sequestered by plants. (This deliberate mention of natural sequestration leads into part II). Proceed to part II, next page. Part II: Carbon does not just sit still in a given reservoir. Certain transfers (called “fluxes”) move carbon from one reservoir to another. For instance, when plants engage in photosynthesis, they pull carbon dioxide from the atmosphere and lock it up in the vegetation + soils reservoir. When animals eat plants and then metabolize the carbon in their food, they exhale carbon dioxide, a flux that returns the carbon to the atmosphere again. The following table lists some of the natural fluxes between carbon reservoirs, in gigatonnes of carbon per year, with human-induced changes shown in bold type: How much carbon is removed from the atmosphere? How much carbon is put out into the atmosphere? Fossil fuel burning by people (none) ↑ 9 gtC/yr Photosynthesis ↓ 120 gtC/yr natural and another 3 gtC/yr from people burning fossil fuels (none) Plant respiration (none) ↑ 60 gtC/yr (none) ↑ 60 gtC/yr ↓ 90 gtC/yr natural and another 2 gtC/yr from people burning fossil fuels (none) (none) ↑ 90 gtC/yr Volcanic eruptions (none) ↑ 0.15 gtC/yr Weathering of continental crust ↓ 0.15 gtC/yr (none) Microbial and fungal respiration in soil Absorption into the oceans across the ocean/atmosphere interface Degassing from oceans across the ocean/atmosphere interface (Data source: NASA) Discussion: Instructors can consult the accompanying spreadsheet for how to calculate percentages of reservoir totals. (The spreadsheet is reproduced on last page of this PDF.) 3. Over the course of a year, which reservoirs are least affected by carbon fluxes? You can evaluate the answer to this question by calculating what percentage “turns over” each year. (To answer this question, divide each reservoir’s annual flux by the size of the total reservoir. Which one has the smallest number?) The crust and mantle, being the largest reservoirs, are least affected by any of the fluxes. The exchange of less than a gigatonne of carbon in or out per year (in these data) is negligible as a % of their total bulk. 4. Over the course of a year, which reservoirs are most affected by carbon fluxes? As with the previous question, you can evaluate the answer to this question by calculating what percentage “turns over” each year. (To answer this question, divide each reservoir’s annual flux by the size of the total reservoir. Which one has the biggest number?) The atmosphere, being the smallest reservoir, is most affected by all fluxes. For photosynthesis, for instance, 14.4% of the atmosphere’s carbon is exchanged with plants each year through photosynthesis. Yet this same exchange “means less” to the plants/soils reservoir, representing only 3.2% of its total carbon load. 5. Now that humans are burning fossil fuels, what is the net change in the size of the atmospheric reservoir from one year to the next? (Express your answer in gigatonnes.) +4 gt (+9 -3 -2) 6. Each gigaton of carbon that ends up being shifted from the “fossil fuel” reservoir into the atmosphere increases the proportion of the atmosphere that is carbon dioxide. Typically, we measure the CO2 proportion of the atmosphere in parts per million by volume (ppm). Each ppm is equivalent to about 2 gigatonnes of carbon. Based on this conversion factor, by how many ppm would you expect the atmospheric concentration of CO2 to increase each year? (+4 gt/year increase) / (2 gt/ppm conversion factor) = 2 ppm / year increase 7. Look up the current concentration of CO2 in the atmosphere at this website: http://www.esrl.noaa.gov/gmd/ccgg/trends/ If your answer to #6 above is accurate and continues unchanged into the future, what would you expect the concentration of CO2 to be in Earth’s atmosphere 10 years from now? . . . 100 years from now? . . . 1000 years from now? Current level + 20 or + 200 or + 2000 (So, approximately 400 ppm now would make for 420 ppm in 10 years, 600 ppm in 100 years, and 2400 in a thousand years.) 8. What percentage change in the overall “carbon load” of the atmospheric reservoir does this represent, as compared to pre-Industrial Revolution levels of ~280 ppm? Pre-Industrial levels were ~280, so: Today: 400/280 = 143% +10 years 420/280 = 150% +100 years 600/280 = 214% +1000 years 2400/280 = 857% 9. This simple linear prediction is unlikely to come true, however. What complications make it difficult to accurately predict the future size of the “atmosphere” reservoir? Future policy changes (carbon tax), technological advances (cheaper solar energy, say, or an “artificial tree” to capture and sequester carbon), or unexpected natural forcings (e.g. a comet impacting a limestone plateau, etc.) Magnitude of flux (gigatonnes of carbon) Reservoir Atmosphere Vegetation + soils Fossil fuels still unburnt Oceans Crust Mantle Size of reservoir (gigatonnes of carbon) 852 3,800 4,300 38,000 5,700,000 10,000,000 Photosynthesis and plant respiration Microbial and fungal respiration in soil 123 123 60 60 Fossil fuel burning Absorption/release into the oceans across the ocean/atmosphere interface Volcanic eruptions Weathering of continental crust 9 90 0.15 0.15 9 92 0.15 0.15 What percentage of each reservoir turns over annually? (i.e. What percentage of the carbon is replaced/exchanged with other reservoirs?) Reservoir Atmosphere 100.0% 14.4% high 7.0% 1.1% 10.6% 0.0% Vegetation + soils 100.0% 3.2% 1.6% Fossil fuels still unburnt 100.0% 0.2% Oceans 100.0% 0.2% Crust 100.0% Mantle 100.0% 0.0% low 0.0% 0.0%


