cancer-detection-using-image-processing-and-machine-learning-IJERTV8IS060299
advertisement

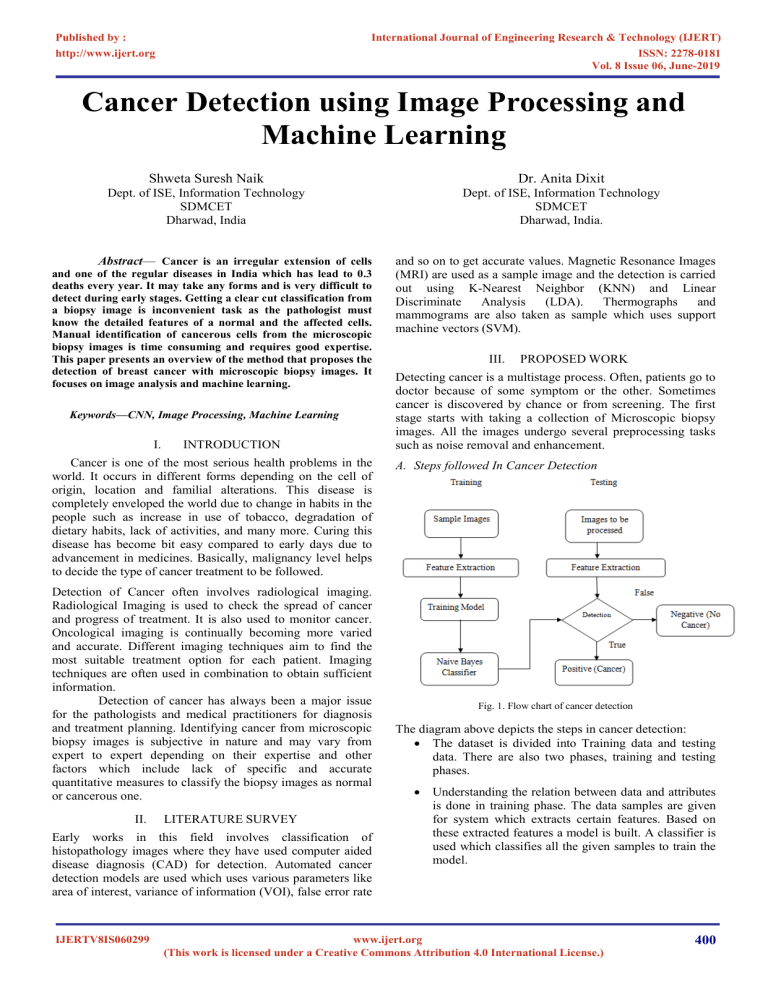
Published by : http://www.ijert.org International Journal of Engineering Research & Technology (IJERT) ISSN: 2278-0181 Vol. 8 Issue 06, June-2019 Cancer Detection using Image Processing and Machine Learning Shweta Suresh Naik Dr. Anita Dixit Dept. of ISE, Information Technology SDMCET Dharwad, India Dept. of ISE, Information Technology SDMCET Dharwad, India. Abstract— Cancer is an irregular extension of cells and one of the regular diseases in India which has lead to 0.3 deaths every year. It may take any forms and is very difficult to detect during early stages. Getting a clear cut classification from a biopsy image is inconvenient task as the pathologist must know the detailed features of a normal and the affected cells. Manual identification of cancerous cells from the microscopic biopsy images is time consuming and requires good expertise. This paper presents an overview of the method that proposes the detection of breast cancer with microscopic biopsy images. It focuses on image analysis and machine learning. Keywords—CNN, Image Processing, Machine Learning I. INTRODUCTION Cancer is one of the most serious health problems in the world. It occurs in different forms depending on the cell of origin, location and familial alterations. This disease is completely enveloped the world due to change in habits in the people such as increase in use of tobacco, degradation of dietary habits, lack of activities, and many more. Curing this disease has become bit easy compared to early days due to advancement in medicines. Basically, malignancy level helps to decide the type of cancer treatment to be followed. Detection of Cancer often involves radiological imaging. Radiological Imaging is used to check the spread of cancer and progress of treatment. It is also used to monitor cancer. Oncological imaging is continually becoming more varied and accurate. Different imaging techniques aim to find the most suitable treatment option for each patient. Imaging techniques are often used in combination to obtain sufficient information. Detection of cancer has always been a major issue for the pathologists and medical practitioners for diagnosis and treatment planning. Identifying cancer from microscopic biopsy images is subjective in nature and may vary from expert to expert depending on their expertise and other factors which include lack of specific and accurate quantitative measures to classify the biopsy images as normal or cancerous one. II. LITERATURE SURVEY Early works in this field involves classification of histopathology images where they have used computer aided disease diagnosis (CAD) for detection. Automated cancer detection models are used which uses various parameters like area of interest, variance of information (VOI), false error rate IJERTV8IS060299 and so on to get accurate values. Magnetic Resonance Images (MRI) are used as a sample image and the detection is carried out using K-Nearest Neighbor (KNN) and Linear Discriminate Analysis (LDA). Thermographs and mammograms are also taken as sample which uses support machine vectors (SVM). III. PROPOSED WORK Detecting cancer is a multistage process. Often, patients go to doctor because of some symptom or the other. Sometimes cancer is discovered by chance or from screening. The first stage starts with taking a collection of Microscopic biopsy images. All the images undergo several preprocessing tasks such as noise removal and enhancement. A. Steps followed In Cancer Detection Fig. 1. Flow chart of cancer detection The diagram above depicts the steps in cancer detection: • The dataset is divided into Training data and testing data. There are also two phases, training and testing phases. • Understanding the relation between data and attributes is done in training phase. The data samples are given for system which extracts certain features. Based on these extracted features a model is built. A classifier is used which classifies all the given samples to train the model. www.ijert.org (This work is licensed under a Creative Commons Attribution 4.0 International License.) 400 Published by : http://www.ijert.org International Journal of Engineering Research & Technology (IJERT) ISSN: 2278-0181 Vol. 8 Issue 06, June-2019 • In testing phase, the images are provided and the same features encountered during training phase are extracted. • The new images are compared and classified depending on color, shape, arrangement. At this point the images are detected and they are shown as positive or negative. • The positive result depicts, the cells are cancerous and the negative result depicts that the cells are noncancerous. IV. METHODOLOGY A. Architectural Diagram texture features, Law’s Texture Energy (LTE) based features, Tamura’s features, and wavelet features. • Finally the images are classified using Naive Bayes classifier. V. IMPLEMENTATION Implementation has two phases: a) Image Processing b) Machine Learning In Image Processing module it takes the images as input and is loaded into the program. This image is chopped into 12 segments and CNN (Convolution Neural Networks) is applied for each segment. There are four options given to the program which is given below: • Benign cancer • Insitu Cancer • Invasive Cancer • Normal The CNN extracts the percent of each type of Cancer cell present in each segment. After extraction it takes the average of the 12 parts and that output will be stored to another file which acts as the intermediate output, this file is further given to the Machine learning for the prediction. Fig. 3. Cell Image In Machine learning has two phases, training and testing. In training phase, the intermediate result generated is taken from Image Fig. 2. Architectural Diagram of cancer detection processing part and Naive Bayes theorem is applied. Naive Bayes algorithm will be trained with such type of data and it provides Architectural diagram contains various steps: the results shown below as positive or negative. • Microscopic tested image is taken as input after Test Cases: undergoing biopsy. The images are enhanced before segmentation to remove noise. • Segmentation is done based on the input images which contains nuclei, cytoplasm and other features. They are segmented on the basis of region, threshold or a cluster and particular algorithms are applied. • In feature extraction, various biologically interpretable and clinically notable shape and morphology based features are extracted from the segmented images which include grey level texture features, colour based features, colour grey level IJERTV8IS060299 Fig. 4. Output when cancer cells are found www.ijert.org (This work is licensed under a Creative Commons Attribution 4.0 International License.) 401 Published by : http://www.ijert.org International Journal of Engineering Research & Technology (IJERT) ISSN: 2278-0181 Vol. 8 Issue 06, June-2019 Fig. 5. Output when cancer cells are not found VI. RESULTS A. Intermediate Outputs: a. Calculate the cancer rate (percentage) from each segment. b. Average of all the segments is written to the file. Fig. 8. Average of all segments is written to the file Different types of images are processed to get these types of results. Data will be given to Naive Bayes algorithm to train. In testing phase, trained data is used to classify the image as positive or negative. CONCLUSION In this paper, an automated detection and classification methods were presented for detection of cancer from microscopic biopsy images. A microscopic biopsy images will be loaded from file in program. By using Image processing images are read and segmented using CNN algorithm. Machine learning is used to train and test the images. It tests the images and it gives result as positive or negative. This method takes less time and also predicts right results. REFERENCES [1] [2] Fig. 6. Percentage of type of cancer in each segment [3] [4] [5] [6] A. D. Belsare and M. M. Mushrif, ”Histopathology Image Analysis Using Image Processing Technique”, publisher Research Gate, 2011 Mahin Ghorbani and Hamed Karimi, “Role of Biotechnology in Cancer Control”, publisher Research Gate, 2015 Mitko Veta∗, Josien P. W. Pluim, Paul J. van Diest, and Max A. Viergever, “Breast Cancer Histopathology Image Processing”, publisher IEEE, 2014 Rajamanickam Baskar, Kuo Ann Lee, Richard Yeo and Kheng-Wei Yeoh, “Cancer and Radiation Therapy: Current Advances and Future Directions”, publisher Ivyspring International, 2012 Yapeng Hu and Liwu Fu, “Targeting Cancer Stem Cells: A new therapy to cure patients”, 2012 G. Landini, D. A. Randell, T. P. Breckon, and J. W. Han, “Morphologic characterization of cell neighborhoods in neoplastic and preneoplastic epithelium,” Analytical and Quantitative Cytology and Histology, vol. 32,no.1,pp.30–38,2010. Fig. 7. Segmented Image IJERTV8IS060299 www.ijert.org (This work is licensed under a Creative Commons Attribution 4.0 International License.) 402


