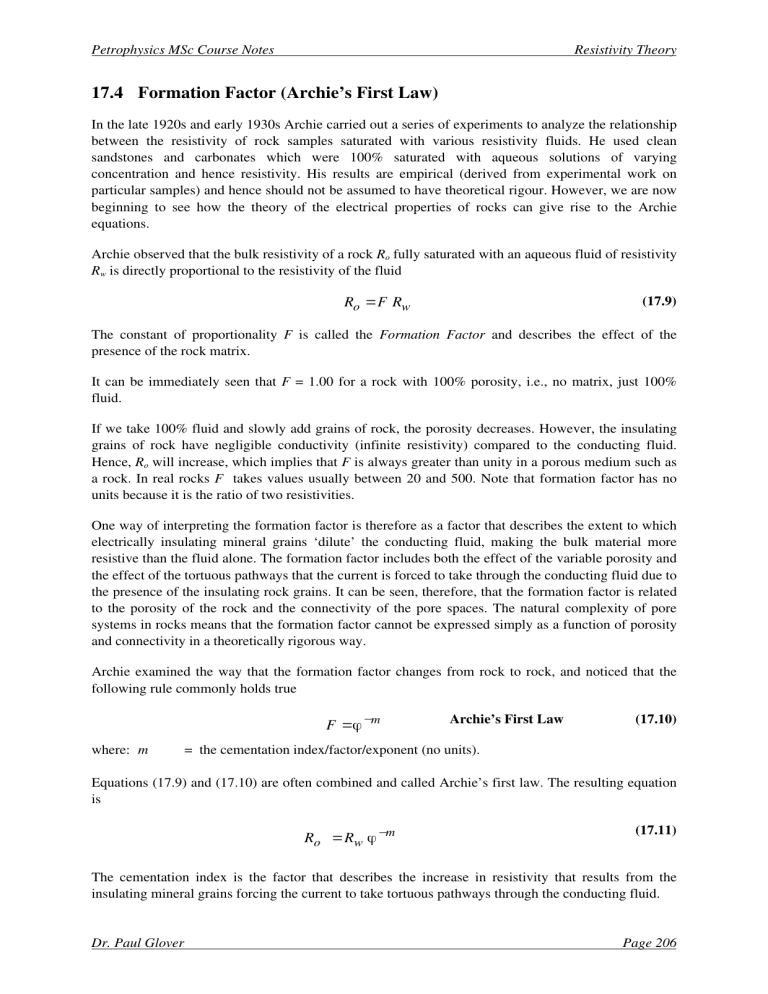
Petrophysics MSc Course Notes Resistivity Theory 17.4 Formation Factor (Archie’s First Law) In the late 1920s and early 1930s Archie carried out a series of experiments to analyze the relationship between the resistivity of rock samples saturated with various resistivity fluids. He used clean sandstones and carbonates which were 100% saturated with aqueous solutions of varying concentration and hence resistivity. His results are empirical (derived from experimental work on particular samples) and hence should not be assumed to have theoretical rigour. However, we are now beginning to see how the theory of the electrical properties of rocks can give rise to the Archie equations. Archie observed that the bulk resistivity of a rock Ro fully saturated with an aqueous fluid of resistivity Rw is directly proportional to the resistivity of the fluid (17.9) Ro =F Rw The constant of proportionality F is called the Formation Factor and describes the effect of the presence of the rock matrix. It can be immediately seen that F = 1.00 for a rock with 100% porosity, i.e., no matrix, just 100% fluid. If we take 100% fluid and slowly add grains of rock, the porosity decreases. However, the insulating grains of rock have negligible conductivity (infinite resistivity) compared to the conducting fluid. Hence, Ro will increase, which implies that F is always greater than unity in a porous medium such as a rock. In real rocks F takes values usually between 20 and 500. Note that formation factor has no units because it is the ratio of two resistivities. One way of interpreting the formation factor is therefore as a factor that describes the extent to which electrically insulating mineral grains ‘dilute’ the conducting fluid, making the bulk material more resistive than the fluid alone. The formation factor includes both the effect of the variable porosity and the effect of the tortuous pathways that the current is forced to take through the conducting fluid due to the presence of the insulating rock grains. It can be seen, therefore, that the formation factor is related to the porosity of the rock and the connectivity of the pore spaces. The natural complexity of pore systems in rocks means that the formation factor cannot be expressed simply as a function of porosity and connectivity in a theoretically rigorous way. Archie examined the way that the formation factor changes from rock to rock, and noticed that the following rule commonly holds true F =φ −m where: m Archie’s First Law (17.10) = the cementation index/factor/exponent (no units). Equations (17.9) and (17.10) are often combined and called Archie’s first law. The resulting equation is Ro = Rw φ −m (17.11) The cementation index is the factor that describes the increase in resistivity that results from the insulating mineral grains forcing the current to take tortuous pathways through the conducting fluid. Dr. Paul Glover Page 206 Petrophysics MSc Course Notes Resistivity Theory The cementation factor has a theoretical value of unity for uniform pores that penetrate the rock directly from one side of the sample to the other (i.e., direct tubes of pore space), and is zero for a rock with 100% porosity (i.e., no grains to get in the way of the fluid flow). No other values of the cementation factor are able to be defined in a purely theoretical way in rocks due to the complexity of the way that pore spaces are arranged. In real rocks the cementation index usually varies between 1.0 and 3.0. Values between 1.0 and 1.4 are associated with igneous and metamorphic rocks that contain fractures. Fractures are a form of porosity that is localized and well connected, and hence approximates to the situation where we had uniform tubes of porosity going through the sample. Values between 1.4 and 2.0 are found in sandstones, with the higher values found in more consolidated sandstones, where the current flow paths are more tortuous. Values between 2.0 and 2.6 are typical for carbonates, and represent a greater degree of tortuosity in the current flow that is found in carbonates because much of the porosity in carbonates is unconnected (e.g., vugs). Both the formation factor and the cementation exponent can be measured on core plugs in the laboratory. This is done in the following way for a single plug. Clean and dry the rock sample. Measure the porosity of the rock sample with helium or with a fluid saturation technique. Saturate the rock with a conductive fluid if not already done in the porosity determination step. Measure the bulk resistivity of the rock saturated with the fluid. Measure the resistivity of the fluid that saturates the rock in a separate vessel. Rearrange and apply Eq.(17.9) to obtain the formation factor. Rearrange and apply Eq. (17.11) to obtain the cementation exponent. • • • • • • • 10000 If there is a suite of such measurements from core plugs from a particular formation, a mean cementation exponent can be obtained graphically by plotting F against φ on log-log graph paper, which gives a straight line for a given lithotype, which intersects F=1 when φ=1, and with a gradient equal to –m. This is shown in Fig. 17.7. -m F=φ Formation Factor 1000 Note that sometimes a constant ‘a’ is placed before the porosity term, and so F=a when φ=1. However, there is no physical justification for this term. It arises from applying a best fit engineering equation to F versus porosity data, and should be avoided. 100 10 Gradient=-m 1 0.01 Figure 17.7 Cementation exponent from a formation factor-porosity cross-plot. 0.1 1 Porosity Dr. Paul Glover Page 207 Petrophysics MSc Course Notes Resistivity Theory Figure 17.8 Cementation exponent from a formation factor-porosity cross-plot. Figure 17.8 shows a formation factor-porosity cross-plot for various values of the cementation exponent. It should be mentioned that there are a range of equations used in the oil industry to calculate the formation factor. Archie’s equation is the most flexible, and the others are simply specific cases of it that have been shown to work empirically for a given type of rock. In all cases the equations have been derived from fitting a best line to a set of real data. The empirical relationships this provides, therefore includes values of a which are non-unity. Also, one should be extremely careful to only apply the equations when you are sure that they are valid. This often means going back to the original papers to see what type of rocks the equations have been derived from. By comparison the use of Archie’s equation with known cementation exponent is more reliable, and should ALWAYS be used if the cementation exponent is known. Dr. Paul Glover Page 208 Petrophysics MSc Course Notes Resistivity Theory The Humble Formula. This is applied to soft formations and to clean sandstones with a sucrosic texture. F =0.62 ×φ −2.15 (17.12) F =0.81 ×φ −2 (17.13) The Soft Formation Formula. The Low Porosity Carbonate Formula. Valid for low porosity clean carbonates with no fracturing. F =φ −m where m =1.87 + 0.019 φ (17.14) 17.5 Partial Water Saturation (Archie’s Second Law) Archie also examined the work of other investigators who did experiments on the resistivity of partially saturated sandstones. He observed that the bulk resistivity of a rock Rt partially saturated with an aqueous fluid of resistivity Rw is directly proportional to the resistivity of the rock when fully saturated with the same fluid, i.e., (17.15) Rt = I Ro The constant of proportionality I is called the resistivity index and describes the effect of partial desaturation of the rock. • • If the rock is fully saturated, I=1.00. If the rock is full of dry air (i.e., not saturated with a conductive fluid), I→ ∞. The resistivity index therefore varies between unity and infinity depending upon the degree of saturation of the rock. Archie observed that the following relationship exists empirically for sandstones I =S w−n where: Sw I n Archie’s Second Law (17.16) = the fractional water saturation of the rock = the resistivity index = the saturation exponent. Again, the last two equations can be combined into a form which is usually referred to as Archie’s second law Rt = Ro S w−n (17.17) The saturation exponent normally has a range of values from 1.8 to 2.0, however much lower and much higher values have been found. Dr. Paul Glover Page 209 Petrophysics MSc Course Notes Resistivity Theory The value of the saturation exponent can be obtained from laboratory experiments on core samples. The procedure is as follows for a single core sample: • • • • • • Follow the procedure to measure the resistivity of a sample saturated completely with a conductive fluid as outlined in the last section. Replace in a step-wise manner some of the conductive fluid in the rock with a non-conductive fluid (e.g., gas) allowing for equilibrium to be attained at each step. Measure the resistivity of the sample when equilibrium is attained at the end of each step. Calculate from measurements of the evolved fluids and prior knowledge of the pore volume of the sample, the conductive fluid saturation in the sample at the end of each step. Rearrange and apply Eq. (17.15) to calculate the saturation index. Rearrange and apply Eq. (17.17) to calculate the saturation exponent. These experiments are extremely time consuming as one has to wait a long time for the samples to come to equilibrium. As before, a mean saturation exponent can be calculated from such measurements on a suite of cores. In this case the resistivity index I is plotted against the water saturation Sw, again on log-log paper (Fig. 17.9). The result is a straight line intersecting I=1 when Sw=1, and with a gradient equal to –n. 10000 -n w I=S Resistivity Index 1000 100 10 Gradient=-n 1 0.01 0.1 1 Water Saturation Figure 17.9 Saturation exponent from a resistivity index-water saturation cross-plot. Dr. Paul Glover Page 210


