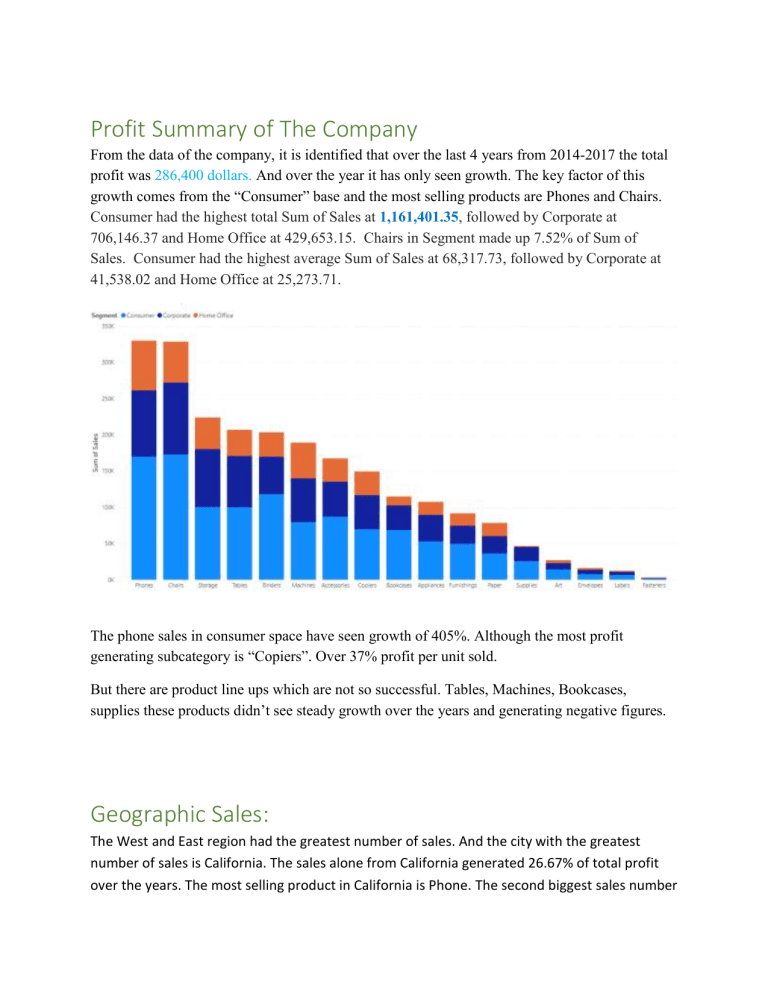
Profit Summary of The Company From the data of the company, it is identified that over the last 4 years from 2014-2017 the total profit was 286,400 dollars. And over the year it has only seen growth. The key factor of this growth comes from the “Consumer” base and the most selling products are Phones and Chairs. Consumer had the highest total Sum of Sales at 1,161,401.35, followed by Corporate at 706,146.37 and Home Office at 429,653.15. Chairs in Segment made up 7.52% of Sum of Sales. Consumer had the highest average Sum of Sales at 68,317.73, followed by Corporate at 41,538.02 and Home Office at 25,273.71. The phone sales in consumer space have seen growth of 405%. Although the most profit generating subcategory is “Copiers”. Over 37% profit per unit sold. But there are product line ups which are not so successful. Tables, Machines, Bookcases, supplies these products didn’t see steady growth over the years and generating negative figures. Geographic Sales: The West and East region had the greatest number of sales. And the city with the greatest number of sales is California. The sales alone from California generated 26.67% of total profit over the years. The most selling product in California is Phone. The second biggest sales number was generated from New York and here also Phone is the most sold product. Although our most profitable product(Copiers)buyers are in Indiana. Buying Season Our products are most sold on 4th quarter in the holiday season. Between September to December is the most selling season of the company. Though there is a general spike in the sales is seen in March. Takeaways The most successful category is Technology. The most selling subcategory is Phone and chair. Most profitable subcategory is Copiers. The hot season for the company is 4th Quarter. The Most Selling region is East and west. The most selling states are California and New York. Dumb customer category had the most sales. Indiana is the most profitable product buyers.


