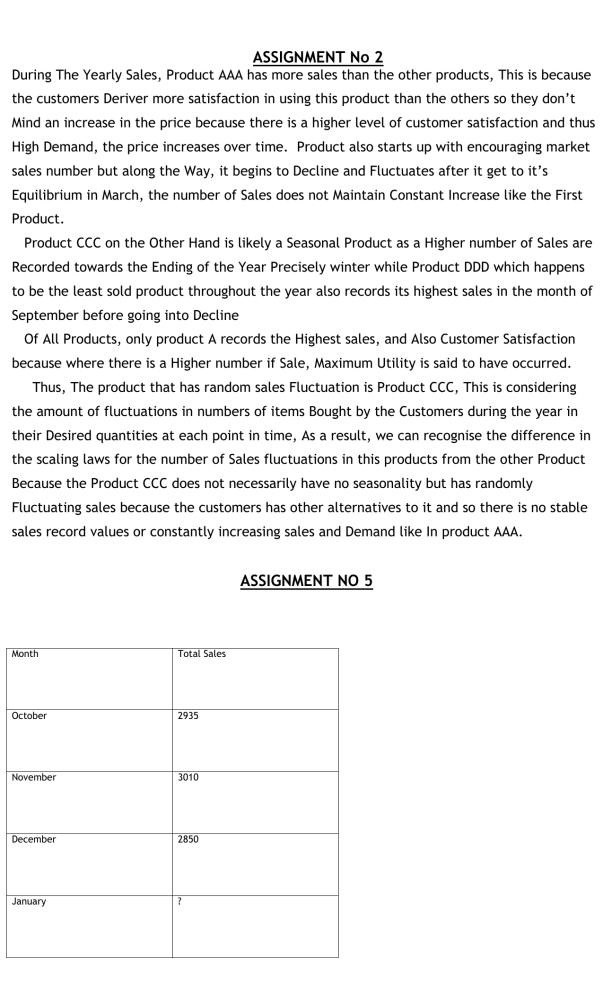
ASSIGNMENT No 2 During The Yearly Sales, Product AAA has more sales than the other products, This is because the customers Deriver more satisfaction in using this product than the others so they don’t Mind an increase in the price because there is a higher level of customer satisfaction and thus High Demand, the price increases over time. Product also starts up with encouraging market sales number but along the Way, it begins to Decline and Fluctuates after it get to it’s Equilibrium in March, the number of Sales does not Maintain Constant Increase like the First Product. Product CCC on the Other Hand is likely a Seasonal Product as a Higher number of Sales are Recorded towards the Ending of the Year Precisely winter while Product DDD which happens to be the least sold product throughout the year also records its highest sales in the month of September before going into Decline Of All Products, only product A records the Highest sales, and Also Customer Satisfaction because where there is a Higher number if Sale, Maximum Utility is said to have occurred. Thus, The product that has random sales Fluctuation is Product CCC, This is considering the amount of fluctuations in numbers of items Bought by the Customers during the year in their Desired quantities at each point in time, As a result, we can recognise the difference in the scaling laws for the number of Sales fluctuations in this products from the other Product Because the Product CCC does not necessarily have no seasonality but has randomly Fluctuating sales because the customers has other alternatives to it and so there is no stable sales record values or constantly increasing sales and Demand like In product AAA. ASSIGNMENT NO 5 Month Total Sales October 2935 November 3010 December 2850 January ? M1 = Y1 = 2935 M2 = 0.2Y2 + 0.8M2 = 602 + 2348 = 2950 M3 = 0.2Y3 + 0.8M3 = 0.2(2850) + 0.8 (2950) = 570 + 2360 = 2930 Month Total Sales Demand Forecast October 2935 2935 November 3010 2935 December 2850 2950 January ? 2930
