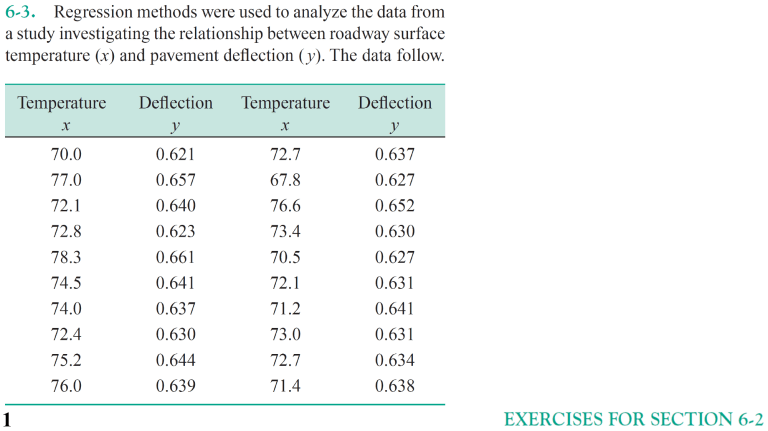
6--3. Regression methods were used to analyze the data from a study investigating the relationship between roadway surface temperature (x) and pavement deflection (y). The data follow. Temperature 1 Temperature X Deflection y X Deflection y 70.0 0.621 72.7 0.637 77.0 0.657 67.8 0.627 72.1 0.640 76.6 0.652 72.8 0.623 73.4 0.630 78.3 0.661 70.5 0.627 74.5 0.641 72.1 0.631 74.0 0.637 71.2 0.641 72.4 0.630 73.0 0.631 75.2 0.644 72.7 0.634 76.0 0.639 71.4 0.638 EXERCISES FOR SECTION 6--2 (a) Estimate the intercept ~0 and slope ~ 1 regression coefficients. Write the estimated regression line. (b) Compute the residuals. (c) Compute SSE and estimate the variance. (d) Find the standard error of the slope and intercept coefficients. (e) Show that SSr =SSR + SSE· (f) Compute the coefficient of determination, R2 . Comment on the value. (g) Use a t-test to test for significance of the intercept and slope coefficients at a =0.05 . Give the P-values of each and comment on your results. (h) Construct the ANOVA table and test for significance of regression using the P-value. Comment on your results and their relationship to your results in part (g). (i) Construct 95% Cls on the intercept and slope. Comment on the relationship of these Cls and your findings in parts (g) and (h). (j) Perform model adequacy checks. Do you believe the model provides an adequate fit? (k) Compute the sample correlation coefficient and test for its significance at a = 0.05. Give the P-value and comment on your results and their relationship to your results in parts (g) and (h). 2 EXERCISES FOR SECTION 6--2 6--9. Consider the data and simple linear regression in Exercise 6-3. (a) Find the mean deflection given that the temperature is 74.0 degrees. (b) Compute a 95% CI on this mean response. (c) Compute a 95% PI on a future observation when temperature is equal to 74.0 degrees. (d) What do you notice about the relative size of these two intervals? Which is wider and why? 3 EXERCISES FOR SECTION 6--2
