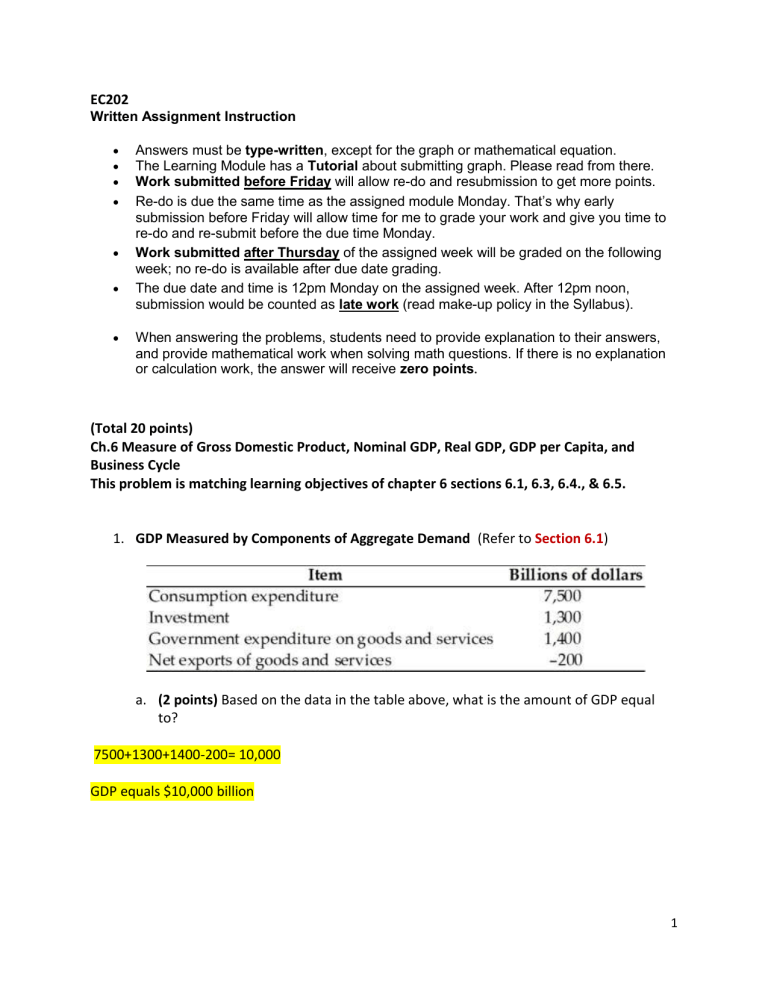
EC202 Written Assignment Instruction Answers must be type-written, except for the graph or mathematical equation. The Learning Module has a Tutorial about submitting graph. Please read from there. Work submitted before Friday will allow re-do and resubmission to get more points. Re-do is due the same time as the assigned module Monday. That’s why early submission before Friday will allow time for me to grade your work and give you time to re-do and re-submit before the due time Monday. Work submitted after Thursday of the assigned week will be graded on the following week; no re-do is available after due date grading. The due date and time is 12pm Monday on the assigned week. After 12pm noon, submission would be counted as late work (read make-up policy in the Syllabus). When answering the problems, students need to provide explanation to their answers, and provide mathematical work when solving math questions. If there is no explanation or calculation work, the answer will receive zero points. (Total 20 points) Ch.6 Measure of Gross Domestic Product, Nominal GDP, Real GDP, GDP per Capita, and Business Cycle This problem is matching learning objectives of chapter 6 sections 6.1, 6.3, 6.4., & 6.5. 1. GDP Measured by Components of Aggregate Demand (Refer to Section 6.1) a. (2 points) Based on the data in the table above, what is the amount of GDP equal to? 7500+1300+1400-200= 10,000 GDP equals $10,000 billion 1 2. Calculate Nominal GDP, Real GDP, Real GDP Growth Rate (Refer to Instructor Note PPT) Hint: This problem is not given the GDP Deflator, so it can’t use GDP Deflator to find real GDP. Read the Instructor PPT note to find real GDP. An economy produces only fun and food. The table shows the prices and the quantities of fun and food produced in 2009 and 2010. The base year is 2009. a. (2 points) Based on the prices and quantities in the table, calculate nominal GDP in 2009 and 2010. Nominal GDP for… 2009: (40x$2) + (60x$3)= $260 2010: (35x$3) + (65x$2)= $235 b. (2 points) Calculate real GDP in 2009 and 2010. Real GDP for… 2009: (40x$2) + (60x$3)= $260 2010: (35x$2) + (65x$3)= $265 c. (2 points) Calculate real GDP growth rate in 2010. Real GDP growth rate in 2010: (($265 - $260) x100)/ $260 = 1.923% growth 3. GDP per Capita (Section 6.4) (2 points) Ethiopia has a GDP of $8 billion (measured in U.S. dollars) and a population of 55 million. Costa Rica has a GDP of $9 billion (measured in U.S. dollars) and a population of 4 million. Calculate the per capita GDP for each country and identify which one is higher. 2 Ethiopia GDP per Capita= 8bil / 55mil= 145.45 $ per capita Costa Rica GDP per Capita= 9 bil / 4 mil= 2,250 $ per capita Costa Rica has a higher GDP per Capita 4. How Well GDP Measure (Section 6.1 and 6.5) a. (2 points) What GDP does not tell about the economy? GDP does not tell us about the sales of used goods, under the table services, which would have accounted for 6.6% or $2 trillion dollars of our GDP in 2013 alone. It does not tell us about transfer payments, because they don’t represent production, or production of home goods because they aren’t sold on the marketplace. b. (2 points) Why GDP per capita might be an imperfect measure of a country’s standard of living? GDP only focuses on production of a country, while standards of living include all elements that affect the citizens wellbeing. For example, if there is a country with a high GDP per capita, that doesn’t mean the people are well off, it may just mean that the people have to work long hours almost every day of the week for very little pay. Which makes the economy look good, but not the peoples standard of living. c. (2 points) What are some other ways to measure the economy? We can also measure the economy with GNP or gross national product and NNP or net national product. GNP is “GNP adds what is produced by domestic businesses and labor abroad, and subtracts out any payments sent home to other countries by foreign labor and businesses located in the United States. In other words, GNP is based more on the production of citizens and firms of a country, wherever they are located, and GDP is based on what happens within the geographic boundaries of a certain country” While NNP, “is calculated by taking GNP and then subtracting the value of how much physical capital is worn out, or reduced in value because of aging, over the course of a year. The process by which capital ages and loses value is called depreciation. The NNP can be further subdivided into national income, which includes all income to businesses and individuals, and personal income, which includes only income to people” 3 5. Business cycle (Section 6.3) Year 1985 1986 1987 1988 1989 1990 1991 1992 1993 1994 1995 1996 1997 1998 1999 2000 2001 Real GDP in billion 6,000 6,300 6,700 7,200 7,850 8,250 8,450 8,550 8,575 8,510 8,370 8,100 7,950 7,925 7,960 8,035 8,155 The information above describes the real GDP for a country for the period from 1985 to 2001. a. (1 points) In which year did the peak occur? The peak occurred in 1993 b. (1 points) The trough occurred in which year? The trough occurred in 1998 c. (1 points) Expansion lasted from which year to which year? Expansion lasted from 1985 to 1993 d. (1 points) What about Recession? Recession lasted from 1993 to 1998 4


