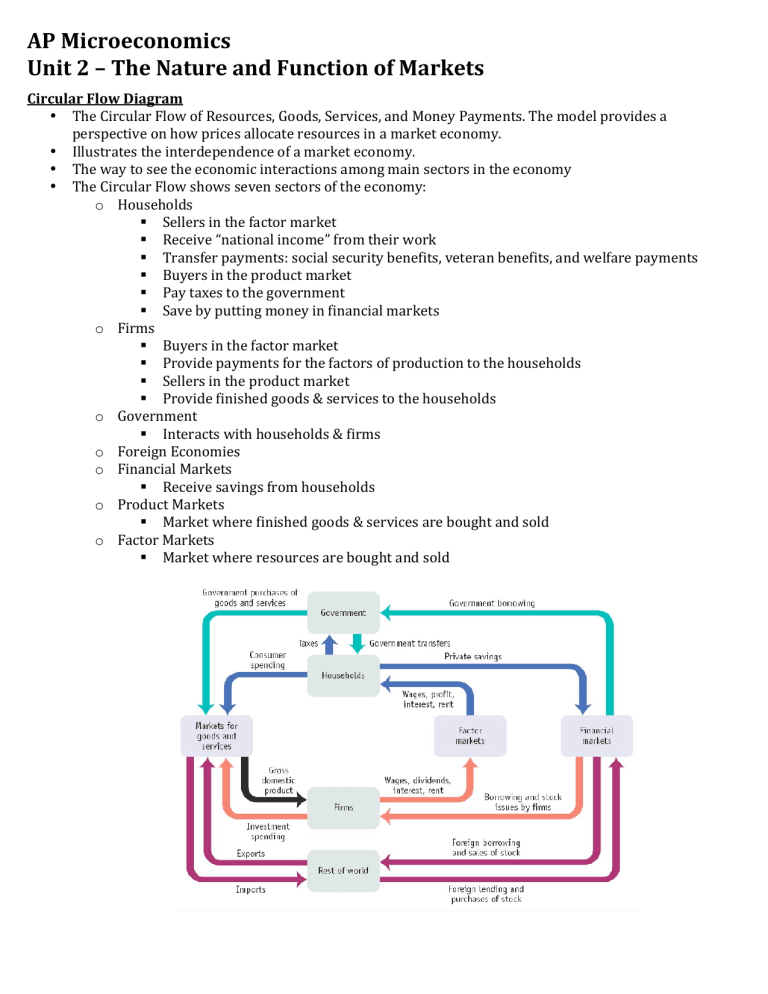
AP Microeconomics Unit 2 – The Nature and Function of Markets Circular Flow Diagram • The Circular Flow of Resources, Goods, Services, and Money Payments. The model provides a perspective on how prices allocate resources in a market economy. • Illustrates the interdependence of a market economy. • The way to see the economic interactions among main sectors in the economy • The Circular Flow shows seven sectors of the economy: o Households Sellers in the factor market Receive “national income” from their work Transfer payments: social security benefits, veteran benefits, and welfare payments Buyers in the product market Pay taxes to the government Save by putting money in financial markets o Firms Buyers in the factor market Provide payments for the factors of production to the households Sellers in the product market Provide finished goods & services to the households o Government Interacts with households & firms o Foreign Economies o Financial Markets Receive savings from households o Product Markets Market where finished goods & services are bought and sold o Factor Markets Market where resources are bought and sold Demand, Supply, & Equilibrium • Demand o The relationship between the quantities of a good consumers are willing and able to purchase at various prices in a given period of time. o Demand curve has an inverse relationship between price and quantity, as depicted in its graph which runs downward from left to right. o The Law of Demand states that consumers buy more of a good when its price is low and less when its price increases. o Determinants of Demand (Line Shifters) Tastes & Preferences (Consumer Expectations) Income Substitutes and Complements Population of Buyers (# of Buyers) • Supply o The relationship between price and the amount that producers are willing and able to sell at various prices in a given period of time. o Supply curve has a direct relationship between price and quantity, as depicted in its graph which runs upward from left to right. o The Law of Supply states that at higher prices, producers are willing to offer more of a product than at the lower prices. o Determinants of Supply (Line Shifters) Technology Price of Inputs Tax OR Subsidy Price of Related Goods Population of Sellers (# of Sellers) • Equilibrium o Also known as the market clearing price. o Point where supply and demand. o Interaction of supply and demand determines price and quantity that will clear the market. • Elasticity / Inelasticity o Elasticity the measure of responsiveness to any stimulus (price change) o Elastic Goods The change in quantity is greater than the change in price Characteristics of Elastic goods • Many substitutes • Not essential to daily life (often luxury items) • Requires large part of budget • Can be purchased later o Inelastic Goods The change in quantity is less than the change in price Characteristics of Inelastic goods • Few substitutes • Necessity for life • Requires small portion of our budget • Must be purchased without delay o How to measure Elasticity Total Revenue Test • Elastic Demand o Price Increases, Total Revenue Decreases o Price Decreases, Total Revenue Increases Unit Elastic Demand o Price Increases, Total Revenue Unchanged o Price Decreases, Total Revenue Unchanged • Inelastic Demand o Price Increases, Total Revenue Increases o Price Decreases, Total Revenue Decreases Elasticity Coefficient • Elasticity of Demand (Ed) o % change in quantity demanded / % change in price E < 1 = inelastic E > 1 = elastic E = unit elastic • o Price Ceilings and Price Floors Legislators have often been dissatisfied with outcomes of free markets “Invisible Hand” not good enough so they mandate prices higher or lower than equilibrium Changing prices are incentives in determining: • What to Produce? How to Produce? For Whom to Produce? Price Ceiling – a legal maximum price that might be charged for a good or service. • Below equilibrium price • Causes a shortage • Allows for illegal markets to develop Price Floor – a legal minimum price that may be charged for a good or service. • Above equilibrium price • Causes surpluses

