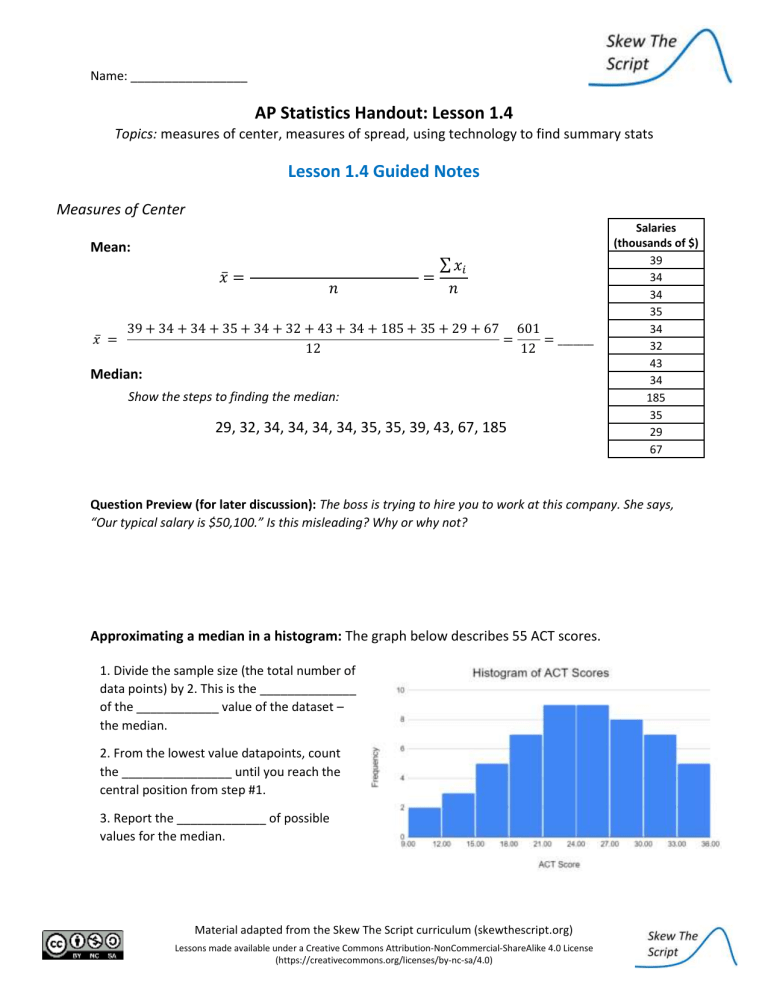
Name: _________________ AP Statistics Handout: Lesson 1.4 Topics: measures of center, measures of spread, using technology to find summary stats Lesson 1.4 Guided Notes Measures of Center Mean: 𝑥̅ = 𝑥̅ = 𝑛 = ∑ 𝑥𝑖 𝑛 39 + 34 + 34 + 35 + 34 + 32 + 43 + 34 + 185 + 35 + 29 + 67 601 = = _______ 12 12 Median: Show the steps to finding the median: 29, 32, 34, 34, 34, 34, 35, 35, 39, 43, 67, 185 Salaries (thousands of $) 39 34 34 35 34 32 43 34 185 35 29 67 Question Preview (for later discussion): The boss is trying to hire you to work at this company. She says, “Our typical salary is $50,100.” Is this misleading? Why or why not? Approximating a median in a histogram: The graph below describes 55 ACT scores. 1. Divide the sample size (the total number of data points) by 2. This is the ______________ of the ____________ value of the dataset – the median. 2. From the lowest value datapoints, count the ________________ until you reach the central position from step #1. 3. Report the _____________ of possible values for the median. Material adapted from the Skew The Script curriculum (skewthescript.org) Lessons made available under a Creative Commons Attribution-NonCommercial-ShareAlike 4.0 License (https://creativecommons.org/licenses/by-nc-sa/4.0) 2 Measures of Spread Range: Range = Max – Min Range = 185 – 29 = _____ Standard Deviation: 𝒔𝒙 = 𝟒𝟑. 𝟔𝟏 The salaries in the dataset are typically $43,610 _______________ the mean. ∑(𝑥𝑖 − 𝑥̅ )2 𝑠𝑥 = √ 𝑛−1 Interquartile Range (IQR): Show the steps to finding the interquartile range (IQR): Formula: IQR = Q3 – Q1 29, 32, 34, 34, 34, 34, 35, 35, 39, 43, 67, 185 Question Preview (for later discussion): Which measure of spread (range, standard dev., or IQR) best represents the “typical” distance between salaries? Why? Material adapted from the Skew The Script curriculum (skewthescript.org) Lessons made available under a Creative Commons Attribution-NonCommercial-ShareAlike 4.0 License (https://creativecommons.org/licenses/by-nc-sa/4.0)

