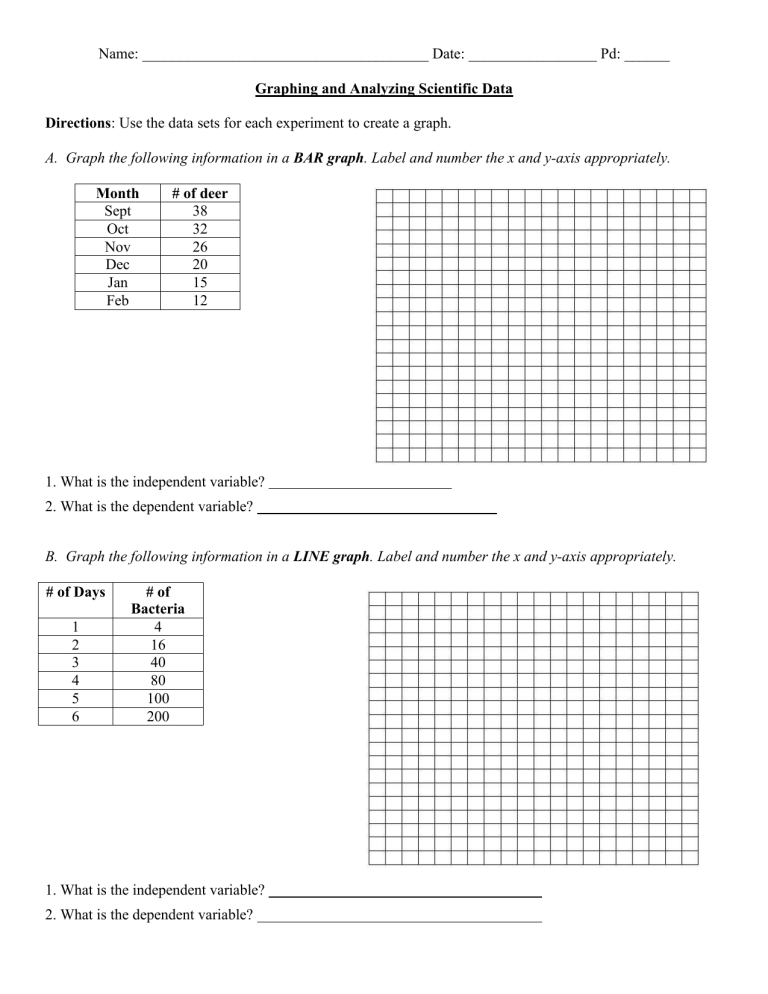
Name: ______________________________________ Date: _________________ Pd: ______ Graphing and Analyzing Scientific Data Directions: Use the data sets for each experiment to create a graph. A. Graph the following information in a BAR graph. Label and number the x and y-axis appropriately. Month Sept Oct Nov Dec Jan Feb # of deer 38 32 26 20 15 12 1. What is the independent variable? 2. What is the dependent variable? B. Graph the following information in a LINE graph. Label and number the x and y-axis appropriately. # of Days 1 2 3 4 5 6 # of Bacteria 4 16 40 80 100 200 1. What is the independent variable? 2. What is the dependent variable? C. Graph the following information in a BAR graph. Label and number the x and y-axis appropriately. # of Hours of Study 0 2 4 6 8 10 Grade 20 60 70 80 90 100 1. What is the independent variable? 2. What is the dependent variable? 3. What is an appropriate title? D. Graph the following information in a LINE graph. Label and number the x and y-axis appropriately. Temperature 0 20 30 40 50 60 70 Enzyme Activity 0 10 15 20 8 5 0 1. What is the independent variable? 2. What is the dependent variable? 3. What is an appropriate title?

