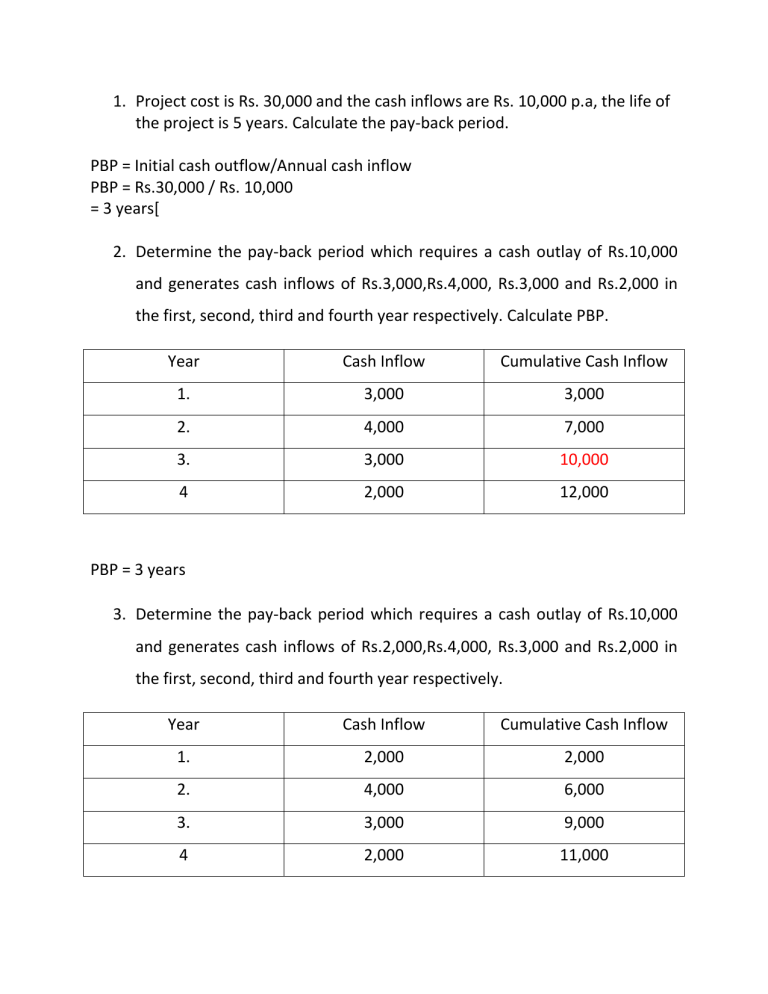
1. Project cost is Rs. 30,000 and the cash inflows are Rs. 10,000 p.a, the life of the project is 5 years. Calculate the pay-back period. PBP = Initial cash outflow/Annual cash inflow PBP = Rs.30,000 / Rs. 10,000 = 3 years[ 2. Determine the pay-back period which requires a cash outlay of Rs.10,000 and generates cash inflows of Rs.3,000,Rs.4,000, Rs.3,000 and Rs.2,000 in the first, second, third and fourth year respectively. Calculate PBP. Year Cash Inflow Cumulative Cash Inflow 1. 3,000 3,000 2. 4,000 7,000 3. 3,000 10,000 4 2,000 12,000 PBP = 3 years 3. Determine the pay-back period which requires a cash outlay of Rs.10,000 and generates cash inflows of Rs.2,000,Rs.4,000, Rs.3,000 and Rs.2,000 in the first, second, third and fourth year respectively. Year Cash Inflow Cumulative Cash Inflow 1. 2,000 2,000 2. 4,000 6,000 3. 3,000 9,000 4 2,000 11,000 PBP = year before full recovery of the Investment +( Number of months in year/the inflow in the beginning of the year ) X amount required for the recovering of the investment PBP = 3 years + (12 months /2,000)X1,000 PBP = 3 Years + 6 months PBP = 3 years and 6 months 4. A large sized chemical company is considering investing in a project that costs Rs. 4,00,000. The estimated salvage value is zero. Tax rate is 55%. The company uses straight line depreciation and the proposed project has cash flows before tax and depreciation (CFBT) as follows Year CFBT 1 1,00,000 2 1,00,000 3 1,50,000 4 1,50,000 5 2,50,000 Calculate PBP Depreciation p.a = (Investment – Salvage value of the Investment) / Life of the project Depreciation p.a = (4,00,000 – 0) / 5 years Depreciation p.a = 80,000 Year CFBD&T Dep CFAD&BT Tax = 55% CFAD&T CIF (CFAD&T + Dep) 1 1,00,000 80,000 20,000 11,000 9,000 89,000 2 1,00,000 80,000 20,000 11,000 9,000 89,000 3 1,50,000 80,000 70,000 38,500 31,500 1,11,500 4 1,50,000 80,000 70,000 38,500 31,500 1,11,500 5 2,50,000 80,000 1,70,000 93,500 76,500 1,56,500 Year CIF Cumulative (CFAD&T CIF + Dep) 1 89,000 89,000 2 89,000 1,78,000 3 1,11,500 2,89,500 4 1,11,500 4,01,000 5 1,56,500 5,57,500 PBP = year before full recovery of the Investment +( Number of months in year/the inflow in the beginning of the year ) X amount required for the recovering of the investment PBP = 3 years + (365 days/1,11,500) X 1,10,500 PBP = 3 years + 362 days/30 days PBP = 3 years + 11 months and 27 5. A company is considering an investment proposal to purchase a machine costing Rs.2,50,000. The machine has a life expectancy of 5 years and Rs. 10,000 is a salvage value. The company’s tax rate is 40%. The firm uses straight line method for providing depreciation. The estimated cash flows before tax and depreciation from the machine are as follows: Year 1 Cash flow before tax and depreciation 60,000 2 70,000 3 90,000 4 1,00,000 5 1,60,000 (including scrap value) Calculate: Pay-back period Depreciation for p.a = (Initial Investment – Scrap Value of the Machine) / Expected life of the Machine Depreciation p.a = (2,50,000 – 10,000) / 5 Depreciation = Rs.48,000 Year CFBD&T Dep CFAD&BT Tax = 40% CFAD&T CIF (CFAD&T + Dep) 1 60,000 48,000 12,000 4,800 7,200 55,200 2 70,000 48,000 22,000 8,800 13,200 61,200 3 90,000 48,000 42,000 16,800 25,200 73,200 4 1,00,000 48,000 52,000 20,800 31,200 79,200 5 1,60,000 48,000 1,12,000 44,800 67,200 1,15,200 Year CIF Cumulative (CFAD&T cash inflow + Dep) 1 55,200 55,200 2 61,200 1,16,400 3 73,200 1,89,600 4 79,200 2,68,800 5 1,15,200 3,84,000 PBP = year before full recovery of the Investment +( Number of months in year/the inflow in the beginning of the year ) X amount required for the recovering of the investment PBP = 3 + ( 365 days/79,200)X 60,400 PBP = 3 + 279 days PBP = 3 years 9 months 9 days 6. The Alpha Company Ltd. Is considering the purchase of a new machine. Two alternative machine ( A and B) have been suggested each costing Rs.4,00,000. Life time of the machine is 5 years. Earnings before tax and after depreciation are expected to be as follows: Year Cash flow before tax and after depreciation Machine A Machine B 100,000 1,20,000 1 2 1,20,000 1,60,000 3 1,60,000 2,00,000 4 2,40,000 1,20,000 5 1,60,000 80,000 State which alternative is suitable under PBP method. For Machine A Year 1 2 3 4 5 CFBT &AD 1,00,000 1,20,000 1,60,000 2,40,000 1,60,000 Tax @ 50% 50,000 60,000 80,000 1,20,000 80,000 Year CF AT &BD 1 2 3 4 5 1,30,000 1,40,000 1,60,000 2,00,000 1,60,000 Cumulative Cash flow 1,30,000 2,70,000 4,30,000 6,30,000 7,90,000 CFAT&D 50,000 60,000 80,000 1,20,000 80,000 Dep 80,000 80,000 80,000 80,000 80,000 CF AT &BD 1,30,000 1,40,000 1,60,000 2,00,000 1,60,000 PBP = year before full recovery of the Investment +( Number of months in year/the inflow in the beginning of the year ) X amount required for the recovering of the investment PBP = 2 + (365 days/1,60,000)X1,30,000 PBP = 2 years + 296 days PBP = 2 years + 9 months 26 days For Machine B Year 1 2 3 4 5 CFBT &AD 1,20,000 1,60,000 2,00,000 1,20,000 80,000 Tax @ 50% 60,000 80,000 1,00,000 60,000 40,000 Year CF AT &BD 1 2 3 4 5 1,40,000 1,60,000 1,80,000 1,40,000 1,20,000 Cumulative Cash flow 1,40,000 3,00,000 4,80,000 6,20,000 7,40,000 CFAT&D 60,000 80,000 100,000 60,000 40,000 Dep 80,000 80,000 80,000 80,000 80,000 CF AT &BD 1,40,000 1,60,000 1,80,000 1,40,000 1,20,000 PBP = year before full recovery of the Investment +( Number of months in year/the inflow in the beginning of the year ) X amount required for the recovering of the investment PBP = 2 year + (365 days / 1,80,000)X 1,00,000 PBP = 2 years + 203 days PBP = 2 years + 6 months + 23 days Machine B can be selected 7. From the following information calculate the PBP of the two projects and suggest which of the two projects should be accepted assuming a discount rate of 10%. Particulars Initial Investment Estimated Life Scrap Value Year 1 2 3 4 5 Project X Project Y Rs.20,000 Rs.30,000 5 yrs 5 years Rs.1000 Rs.2,000 Profit after depreciation and taxes are as follows: 5,000 20,000 10,000 10,000 10,000 5,000 3,000 3,000 2,000 2,000 State which alternative is suitable under PBP method. Year CFAD&T Dep 1 2 3 4 5 5,000 10,000 10,000 3,000 2,000 3,800 3,800 3,800 3,800 3,800 CFAT&BS Discount factor 10% 8,800 0.909 13,800 0.826 13,800 0.751 6,800 0.683 5,800 0.621 PV of Future CI 8,000 11,399 10,362 4,644 3,602 Cumulative PV of Future CI 23,270 12,886 7,961 5,874 4,720 Cumulative 8,000 19,399 29,761 34,405 38,007 Dep = 20,000-1000/5 years Dep = 3,800 PBP = 2 years + (365 days / 10,362)X 601 PBP = 2 Years + 21 days For Project Y Year CFAD&T Dep 1 2 3 4 5 20,000 10,000 5,000 3,000 2,0000 5,600 5,600 5,600 5,600 5,600 CFAT&BS Discount factor 10% 25,600 0.909 15,600 0.826 10,600 0.751 8,600 0.683 7,600 0.621 Dep = 30,000 – 2,000 / 5 Dep = 5,600 PBP = 1 year + (365 days /12,886)X 6,730 PBP = 1 year + 191 days 23,270 36,156 44,117 49,991 54,711 PBP = 1 year + 6 months + 11 days 5. X company is examining two mutually exclusive proposals for the new capital investment. The data on the proposals are as follows: Particulars Net Cash outlay Salvage Value Estimated Life Depreciation Income Tax Cost of Capital (present Value) Year Proposal A Proposal B Rs.40,000 Rs.50,000 Nil Nil 4 Years 5 years Straight Line Method Straight Line Method 50% 50% 10% 10% Earnings before depreciation and taxes I Year II Year III Year IV Year V Year 12,000 14,000 16,000 22,000 - 14,000 16,000 18,000 22,000 20,000 You are asked to advise which proposal would be financially preferable under PBP. Dep = Initial Investment – Salvage value / Life Dep = 40,000 – 0/4 years = Rs.10,000 For B Dep = 50,000 – 0 / 5 years = Rs.10,000 For Proposal A Year 1. 2. 3. CFB D&T 12,000 14,000 16,000 Dep CFAD &BT 10,000 2,000 10,000 4,000 10,000 6,000 Tax = 50% 1,000 2,000 3,000 CFAD &T 1,000 2,000 3,000 CFBD &AT 11,000 12,000 13,000 PV 10% 0.909 0.826 0.751 PV of CI Cumulative 9,999 9,912 9,763 9,999 19,911 29,674 4. 22,000 10,000 12,000 6,000 6,000 16,000 0.683 10,928 40,602 CFBD &AT 12,000 13,000 14,000 16,000 15,000 PV of CI Cumulative 10,908 10,738 10,514 10,928 9,315 10,908 21,646 32,160 43,088 52,403 PBP = 3 Years+( 365 days /10,928)X 10,326 PBP = 3 Years + 345 days PBP = 3 years + 11 months + 15 days For Proposal B Year 1. 2. 3. 4. 5. CFB D&T 14,000 16,000 18,000 22,000 20,000 Dep 10,000 10,000 10,000 10,000 10,000 CFAD &BT 4,000 6,000 8,000 12,000 10,000 Tax = 50% 2,000 3,000 4,000 6,000 5,000 CFAD &T 2,000 3,000 4,000 6,000 5,000 PV 10% 0.909 0.826 0.751 0.683 0.621 PBP = 4 years + (365 days /9,315 ) X 6,912 PBP = 4 years + 271 days PBP = 4 years + 9 months + one day Net Present value method NPV = difference between present value of cash outflow and present value of future cash inflow 9. Initial investment is Rs. 30,000. Life time of the machine is 5 years. The cash inflow for next five years is Rs.10,000 p.a. Discount factor is 10%. Calculate the NPV. Year 1. 2 3 4 5 Cash inflow 10,000 10,000 10,000 10,000 10,000 Discount factor 10% 0.909 0.826 0.751 0.683 0.621 Total present value of future cash inflow Less Investment NPV Present value of future cash inflow 9090 8260 7510 6830 6210 37,900 30,000 7,900 10. X company is examining two mutually exclusive proposals for the new capital investment. The data on the proposals are as follows: Particulars Net Cash outlay Salvage Value Estimated Life Depreciation Income Tax Cost of Capital (present Value) Year I Year II Year III Year IV Year V Year Proposal A Proposal B Rs.40,000 Rs.50,000 Nil Nil 4 Years 5 years Straight Line Method Straight Line Method 50% 50% 10% 10% Earnings before depreciation and taxes 12,000 14,000 16,000 22,000 - 14,000 16,000 18,000 22,000 20,000 You are asked to advise which proposal would be financially preferable under NPV method. Dep = Initial Investment – Salvage value / Life Dep = 40,000 – 0/4 years = Rs.10,000 For B Dep = 50,000 – 0 / 5 years = Rs.10,000 For Proposal A Year 1. 2. 3. 4. CFB D&T 12,000 14,000 16,000 22,000 Dep 10,000 10,000 10,000 10,000 CFAD &BT 2,000 4,000 6,000 12,000 Tax = 50% 1,000 2,000 3,000 6,000 CFAD &T 1,000 2,000 3,000 6,000 CFBD PV &AT 10% 11,000 0.909 12,000 0.826 13,000 0.751 16,000 0.683 Total present value of Future cash inflow Less Investment NPV PV of CI 9,999 9,912 9,763 10,928 40,602 40,000 602 For Proposal B Year 1. 2. 3. 4. 5. CFB D&T 14,000 16,000 18,000 22,000 20,000 Dep 10,000 10,000 10,000 10,000 10,000 CFAD &BT 4,000 6,000 8,000 12,000 10,000 Tax = 50% 2,000 3,000 4,000 6,000 5,000 CFAD &T 2,000 3,000 4,000 6,000 5,000 CFBD PV &AT 10% 12,000 0.909 13,000 0.826 14,000 0.751 16,000 0.683 15,000 0.621 Total present value of future cash inflow Less Investment NPV PV of CI 10,908 10,738 10,514 10,928 9,315 52,403 50,000 2,403 Decision since the proposal B is gives 2,403 , the B can be accepted. 11. From the following information calculate the NPV of the two projects and suggest which of the two projects should be accepted assuming a discount rate of 10%. Particulars Initial Investment Estimated Life Scrap Value Year 1 2 3 4 5 Project X Project Y Rs.20,000 Rs.30,000 5 yrs 5 years Rs.1000 Rs.2,000 Profit after depreciation and taxes are as follows: 5,000 20,000 10,000 10,000 10,000 5,000 3,000 3,000 2,000 2,000 Year CFAD&T Dep 1 2 3 4 5 5 5,000 10,000 10,000 3,000 2,000 scrap 3,800 3,800 3,800 3,800 3,800 CFAT&BS Discount factor 10% 8,800 0.909 13,800 0.826 13,800 0.751 6,800 0.683 5,800 0.621 1,000 0.621 Total present value of future cash inflow Less Investment NPV PV of Future CI 8,000 11,399 10,362 4,644 3,602 621 38,628 20,000 18,628


