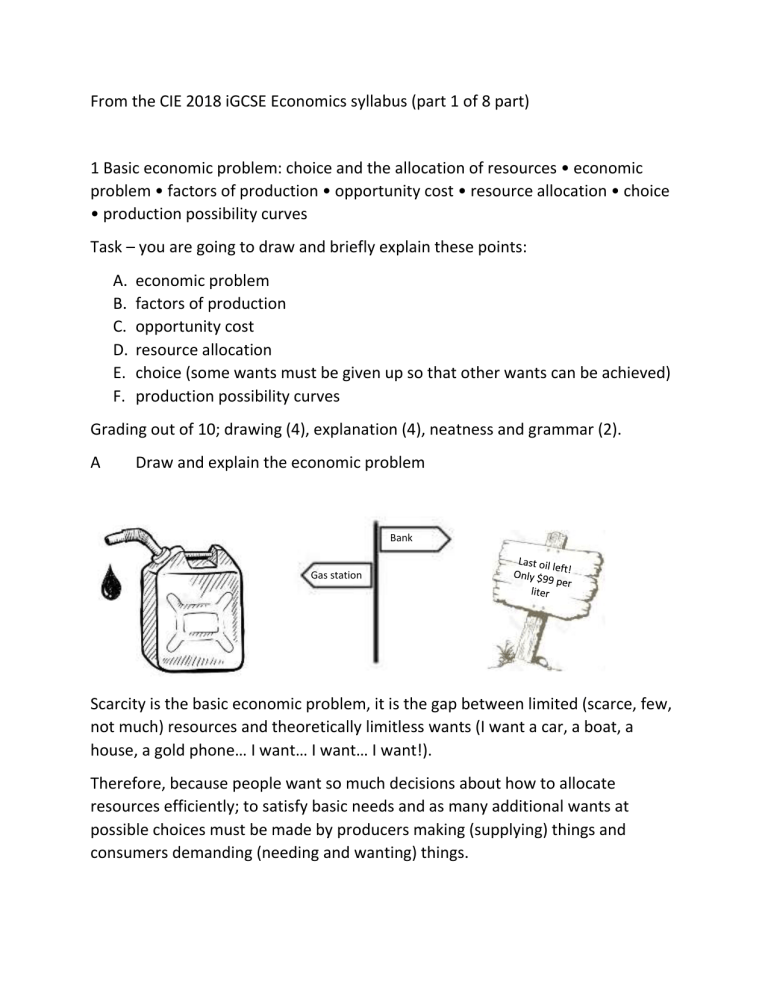
From the CIE 2018 iGCSE Economics syllabus (part 1 of 8 part) 1 Basic economic problem: choice and the allocation of resources • economic problem • factors of production • opportunity cost • resource allocation • choice • production possibility curves Task – you are going to draw and briefly explain these points: A. B. C. D. E. F. economic problem factors of production opportunity cost resource allocation choice (some wants must be given up so that other wants can be achieved) production possibility curves Grading out of 10; drawing (4), explanation (4), neatness and grammar (2). A Draw and explain the economic problem Bank Gas station Scarcity is the basic economic problem, it is the gap between limited (scarce, few, not much) resources and theoretically limitless wants (I want a car, a boat, a house, a gold phone… I want… I want… I want!). Therefore, because people want so much decisions about how to allocate resources efficiently; to satisfy basic needs and as many additional wants at possible choices must be made by producers making (supplying) things and consumers demanding (needing and wanting) things. In summary scarcity is a compromise, to get one resource (fuel or gas) you must usually give up another resource (money). B Draw and explain the factors of production I have idea for a better business Labour Enterprise Capital Land The factors of production is a standard economic term that describes the inputs (things going in to a work process) that are used in the production (making/producing/manufacturing) of goods or services in order to make a profit include land (natural resources), labour (workers time), capital (money invested in things to help get the business going) and enterprise (the idea for a business or entrepreneurship). C Draw the opportunity cost using buying a basketball and football as an example The opportunity cost is the cost of choosing between alternative uses or resources. It is the lost benefit you could have received which is the Next Best Alternative. For example you have $1 and can buy a $1 football or $1 basketball, if you chose the football then the basketball is the NBA. NBA The Next Best Alternative of a $1 football is the $1 basketball not bought or foregone. D Draw the resource allocation using manufacturing cups and mugs as an example This is a different type of opportunity cost. It is a ‘trade off’. For example you make cups and mugs (costing $1 each to make) and with resource allocation you can allocate a resource of $9 to produce (make) 4 cups and 5 mugs or say 3 cups and 6 mugs. Every time you decide how allocate your scare resource of $9 you must decide to make more or less of another. E Draw the choice Choice always involves a cost of something. The cost can be money or time. Every choice requires that some wants must be given up so that other wants can be achieved. I need to choose what to do now Read Economics books Write Economics essays Draw Economics posters Sing about Economics Watch Economics videos Dance about Economics Present Economics All these choices are good but I need to use my time wisely and choose one of two of them and trade-off against the other options/choices. F Draw the production possibility curves (PPC) Basketballs Balls PPC Balls can produce a maximum of 70 basketballs a week and 50 footballs a week 70 60 50 60 Footballs Draw on the graph if Balls decides to produce 60 footballs in one week. What is the opportunity cost of this decision? And briefly explain what a PPC shows. 60 footballs means probably making 60 basketballs so the opportunity cost of 60 footballs is 10 basketballs foregone. The PPC shows the opportunity cost and choice of different production decision and the trade-off caused by choosing a particular course of action (production decision). Extra Draw these goods and services that satisfy the needs and wants of consumers A non-durable consumer good Drawings of Food, drink, soap A durable consumer good Consumer services Drawings of Car, washing machine Drawings of Cafes and holidays Capital goods Drawings of Factories, shops, offices Semi-finished goods Business services Drawings of Paper for books, circuits for computers, screens for phones Drawings of Banking, transportation, advertising From the CIE 2018 iGCSE Economics syllabus (part 1 of 8 part) Task – you are going to draw and briefly explain these points in order. A. B. C. D. E. F. economic problem factors of production opportunity cost resource allocation choice (some wants must be given up so that other wants can be achieved) production possibility curves Grading out of 10; drawing (4), explanation (4), neatness and grammar (2). A Draw and explain the economic problem B Draw and explain the factors of production C Draw the opportunity cost using buying a basketball and football as an example D Draw the resource allocation using manufacturing cups and mugs as an example . E Draw and explain the ‘choice’ F Draw the production possibility curves (PPC) Basketballs Balls PPC Balls can produce a maximum of 70 basketballs a week and 70 50 footballs a week 50 Footballs Draw on the graph if Balls decides to produce 60 footballs in one week. What is the opportunity cost of this decision? And briefly explain what a PPC chows. Extra Draw these goods and services that satisfy the needs and wants of consumers A non-durable consumer good A durable consumer good Consumer services Capital goods Semi-finished goods Business services
